Mastering SaaS Churn Rate Calculation
Learn the essential churn rate calculation formulas and strategies. This guide helps you accurately measure churn to drive SaaS growth and improve retention.

At its core, the churn rate calculation is pretty simple.It's the formula you use to figure out the percentage of customers who decided to cancel their subscriptions over a set period. You just divide the number of customers you lost by the number you had at the start, then multiply by 100 to get that percentage.
But don't let the simple math fool you. Understanding why that number matters is a whole different ball game.
Why Your Churn Rate Is a Critical SaaS Growth Lever

Before we get into the nitty-gritty of the formulas, let's be clear about what churn really represents for a SaaS business. This metric is so much more than just a number on a dashboard; it’s a direct pulse on your customer satisfaction and the overall health of your product. If you ignore it, you’re letting problems fester that can quietly sabotage your growth.
Churn rate is a non-negotiable part of any solid set of Key Performance Indicators (KPIs). It tells a blunt story about how well your company retains the customers you fought so hard to win in the first place.
The Compounding Effect of Churn
A small monthly churn might not seem like a big deal, but its effect snowballs over time, steadily eating away at your customer base and revenue. I always tell people to think of it like a leaky bucket—even a tiny hole will eventually empty it if you aren't pouring water in faster than it’s draining out. This is exactly why a precise churn rate calculation is so crucial.
The gap between monthly and annual churn is often shocking. A seemingly manageable monthly churn of just 5% balloons into losing nearly half (46%) of your customers by the end of the year. If that creeps up to 10% monthly, your annual churn rate skyrockets past 70%. At that point, you're forced to replace the vast majority of your customer base just to break even.
I've seen it firsthand: companies that religiously track and manage their churn spot problems way earlier. They can react to customer feedback faster and, ultimately, build a much more stable and predictable revenue stream. It's a game-changer.
It's More Than Just a Number
Churn sends ripples through every part of your SaaS business, impacting everything from your financial forecasts to whether or not investors take you seriously. A high churn rate is a massive red flag signaling deep-seated issues that demand your immediate attention.
- Revenue Impact: High churn directly deflates your Monthly Recurring Revenue (MRR), turning growth into a grueling uphill climb.
- Valuation Concerns: For any venture-backed company, a high churn rate is one of the first things investors look for. It can seriously harm your valuation and your ability to raise more capital.
- Team Morale: Constantly losing customers is just plain demoralizing. It especially wears down the customer success and support teams who are on the front lines every day.
At the end of the day, getting a handle on your churn rate calculation is the first, most fundamental step toward controlling one of the most powerful levers you have for sustainable growth.
The Essential Formulas for Nailing Your Churn Calculation
Alright, let's roll up our sleeves and get into the actual math. The good news is that the basic churn rate calculation isn't some complex calculus. It's really about having the right numbers and, more importantly, understanding what they truly mean for your business.
We'll start with the metric most people think of when they hear "churn."
Calculating Customer Churn Rate
This one is simple: customer churn rate tells you the percentage of your subscribers who bailed during a specific period. It's the most direct signal of how many people are walking out the door.
The formula itself is pretty straightforward:
(Customers Lost During Period / Customers at Start of Period) x 100 = Customer Churn Rate %
To plug numbers into this, you just need two data points. You can usually pull these right from your payment processor (like Stripe) or your own user database.
- Customers at Start of Period: This is the total number of active, paying customers you had on day one of the period you're measuring (say, April 1st).
- Customers Lost During Period: This is the number of those same customers who cancelled their subscriptions by the end of that period (by April 30th).
Let’s use a fictional SaaS company, "ProjectFlow," to see this in action. On April 1st, ProjectFlow had 1,000 paying customers. Throughout April, 50 of those customers decided to cancel.
Here’s how they'd calculate their customer churn rate:
(50 customers lost / 1,000 customers at start) x 100 = 5% monthly customer churn
That simple number tells a powerful story. A 5% churn rate means ProjectFlow has to acquire 50 brand-new customers the following month just to break even and not shrink.
Calculating Revenue Churn Rate
While customer churn is a vital sign, I've found that revenue churn often paints a much more vivid picture of your company's financial health. This metric measures the percentage of monthly recurring revenue (MRR) you've lost from both cancellations and downgrades.
Why does this matter so much? Because not all customers are created equal. Losing one enterprise client paying $2,000/month stings a lot more than losing five small businesses paying $20/month.
Here’s the formula for revenue churn:
(MRR Lost from Churn & Downgrades / MRR at Start of Period) x 100 = Revenue Churn Rate %
Let's check back in with ProjectFlow. At the beginning of April, their MRR was $50,000. The 50 customers who churned were on various plans, adding up to a total MRR loss of $3,500. On top of that, a few existing customers downgraded to cheaper plans, which shaved off another $500 in MRR.
Their revenue churn calculation looks like this:
(($3,500 + $500) / $50,000) x 100 = 8% monthly revenue churn
Notice the gap here? Their revenue churn is 8%, but their customer churn was only 5%. This is a huge red flag. It tells the ProjectFlow team that they aren't just losing customers; they're losing their highest-value customers. That’s a much more urgent problem than the raw customer count would suggest.
Calculating churn is the first step, but the real magic happens when you start to understand what's driving it. For a deeper look into forecasting, you can learn how to predict customer churn with proven data-driven strategies and get ahead of the problem before it's too late.
Choosing the Right Churn Calculation for Your Model
The churn rate calculation you settle on isn't a one-size-fits-all solution. The method that brings perfect clarity to a high-volume B2C subscription app could be downright misleading for a B2B enterprise company juggling large, annual contracts.
Let’s be honest: using the wrong formula can create a false sense of security. It might mask underlying problems until it’s far too late to fix them.
Your business reality should always dictate your math. A fast-growing company, for instance, might find the simple churn formula frustratingly inaccurate. Why? Because it completely ignores the influx of new customers during the period, which can seriously skew your perception of stability.
When Simple Math Just Isn't Enough
The standard formula works just fine for stable businesses, but it starts to break down under conditions of rapid growth or decline. When you're adding hundreds of new users every month, the denominator in your churn calculation (customers at the start of the period) quickly becomes outdated.
This is exactly where an adjusted churn rate calculation comes into play. It provides a more balanced view by using an average of the customers at the start and end of the period. This method helps normalize the rate when your user base is volatile, giving you a truer signal of your retention health.
Think of it this way: if you’re only measuring against your starting number of customers, you’re ignoring the entire context of your growth. It’s like measuring your car's fuel efficiency only while going downhill—the numbers look fantastic, but they aren’t telling the whole story.
This quick sketch visualizes the core components that go into any churn rate calculation, which form the foundation for the more advanced methods we're about to cover.
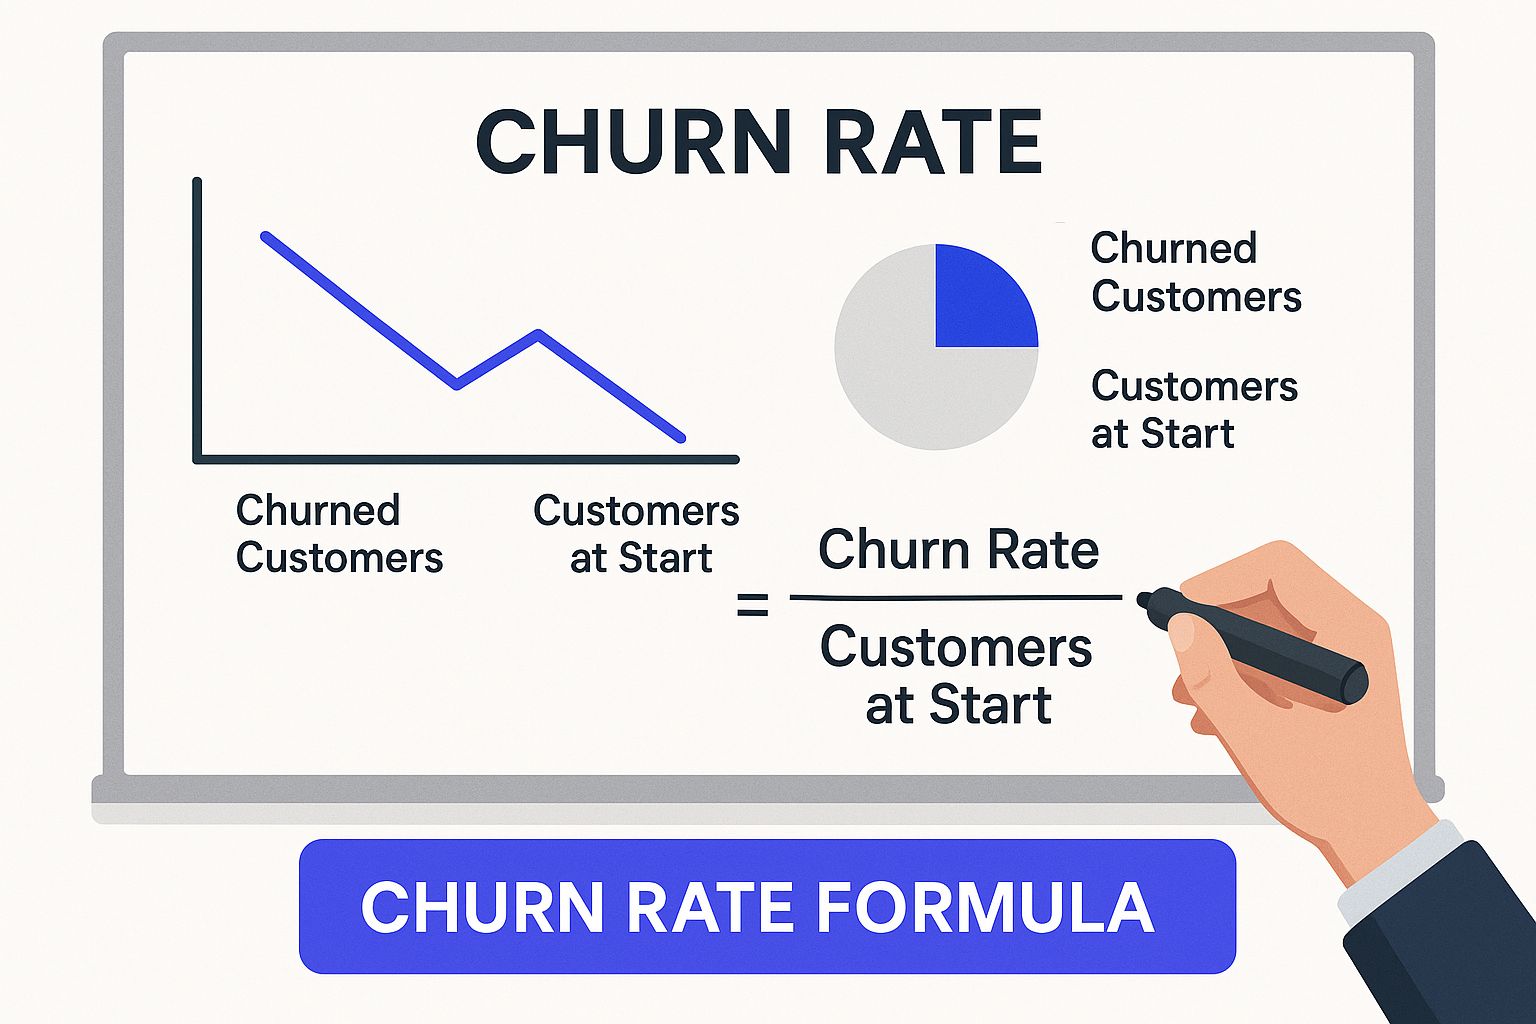
Ultimately, getting a grip on these basic elements is the first step toward picking the right calculation for your specific business needs.
Comparing Your Calculation Options
Selecting the right method means understanding the trade-offs between simplicity and accuracy. Each approach has its place, depending on your company's stage and strategic goals. An early-stage startup, for example, might stick with the simple method for its sheer ease of implementation, while a more mature company will need a much more detailed view to make informed decisions.
The following table breaks down the most common churn calculation methods to help you decide which is the best fit for your team.
Comparing Churn Calculation Methods
In the end, your choice boils down to what question you're trying to answer. Are you just looking for a simple health metric? Or do you need a more accurate, growth-adjusted figure? Perhaps you're after a proactive tool to prevent revenue loss entirely.
Your answer will guide you to the correct churn rate calculation for your model, turning a simple number into a powerful strategic asset.
How to Benchmark Your Churn Rate Against Your Industry
Once you've calculated your churn rate, the next question is always the same: is this number any good? Seeing a 5% monthly churn rate might set off alarm bells, but without context, it’s just a number floating in space.
The truth is, a "healthy" churn rate can look wildly different from one industry to the next. That’s why benchmarking is so critical. It grounds your metrics in reality, stopping you from either panicking over what might be normal or, worse, getting complacent with a number that’s secretly dragging you down.
Comparing your churn to industry averages gives you a realistic baseline. For instance, you wouldn't expect a high-touch B2B service with annual contracts to have the same churn as a direct-to-consumer subscription box. Understanding these nuances is everything.
Understanding Industry Averages
So, what should you be aiming for? While every business has its own unique quirks, industry-wide data gives you a solid starting point.
For most established SaaS companies, a "good" annual churn rate usually lands somewhere between 5% and 7%. That breaks down to a monthly churn of less than 1%.
But these figures are far from universal. A quick look at the data shows just how wide the spectrum really is.
- Early-Stage Startups: It’s common to see higher churn here, often 10-15% annually. These companies are still dialing in their product-market fit, so a bit more churn is part of the journey.
- SaaS & Software: As mentioned, a mature company is shooting for that 5-7% annual sweet spot. This is often held up as the gold standard for subscription software.
- Media & Entertainment: This sector tends to have higher churn. With so much competition for eyeballs and content consumed so quickly, loyalty can be more fleeting.
The real goal isn't just to hit an average number. It's to figure out where you fit. Are you a premium product that should command lower churn, or a mass-market tool where a bit more churn is baked into the model? Context changes the game entirely.
The Impact of Business Model on Churn
Your business model is probably the single biggest factor influencing what a "good" churn rate looks like for you. Who you sell to and what you sell can cause your churn to fluctuate wildly.
Take the consumer packaged goods (CPG) industry, for example. One report found an average churn of around 9.6%, but other research during the pandemic saw that number spike to a massive 40%. The wholesale sector fared even worse, with some estimates hitting 56%. You can dig into more industry-specific churn data to see just how much these numbers can vary.
This huge variance is exactly why a generic "good" churn rate is a myth. To set intelligent, actionable retention goals, you need to find benchmarks that are specific to your sector, customer type (B2B vs. B2C), and company size.
Actionable Strategies to Reduce Customer Churn

Knowing your churn rate is one thing. Actually doing something about it? That's where the real work begins. A low churn rate isn't an accident; it’s the outcome of being proactive and customer-obsessed.
You have to accept that churn is almost always a symptom of a deeper problem, usually stemming from a poor customer experience.
The link between good service and customer loyalty is crystal clear. Research shows 60% of consumers point to strong service quality as a major reason they stick around. Even more telling, customers with positive past experiences spend a whopping 140% more than those with negative ones.
This proves that stopping churn starts long before a customer ever thinks about hitting "cancel."
Create a Frictionless Onboarding Process
You never get a second chance to make a first impression. A clunky or confusing onboarding experience is one of the quickest ways to lose someone before they've even had a chance to see what your product can do.
Your one and only goal here is to guide new users to their "aha!" moment as smoothly as possible.
Instead of a generic tour, personalize the journey. A quick welcome survey can uncover a user's main goal, allowing you to tailor the walkthrough to the exact features that will help them achieve it. This immediate problem-solving builds confidence and shows them your value right out of the gate.
Systematically Act on User Feedback
You can't fix problems you don't know about. Setting up a solid system for collecting, analyzing, and acting on user feedback is absolutely essential. This isn't just about sending an annual survey; it's about building continuous feedback loops.
Here’s how you can do it:
- In-app surveys: Use tools to pop up short, contextual surveys at key moments in the user's journey.
- Cancellation flows: When a user decides to leave, don't just wave goodbye. A well-designed cancellation survey can give you some of the most honest and valuable feedback you'll ever get.
- Closing the loop: This is the most critical part. When you release a feature someone asked for, send them a personal email. Let them know you heard them.
I’ve seen this work firsthand. A simple "We built this because you asked for it" email can turn a frustrated user into your biggest advocate. It's a powerful way to show that real people are listening.
Once you know what's driving people away, implementing effective customer retention strategies becomes your top priority for improving the bottom line.
Deploy Personalized Retention Offers
When a customer hits the cancel button, it doesn't have to be the end of the road. An intelligent cancellation flow can be your last, best chance to change their mind.
By presenting a personalized offer based on their stated reason for leaving, you can intervene at the most critical moment.
For example, if they cite "price" as the problem, you could automatically offer a temporary discount. If they say the product is "too complex," you could prompt them to book a free one-on-one session with a product specialist. These automated, tailored interventions can be surprisingly effective.
You’ll find that many SaaS companies can successfully reduce churn with a handful of proven strategies that prioritize this kind of proactive engagement.
Common Questions About Calculating Churn Rate
Even with the right formulas in hand, some tricky questions always seem to pop up when you're in the weeds of calculating churn. Nailing these details is what separates a vanity metric from a number you can actually use to make smart business decisions.
Let's clear up a few of the most common snags people run into.
What Is a Good Monthly Churn Rate?
This is the million-dollar question, and the honest answer is: it really depends.
For a well-established SaaS company with venture backing, a great benchmark to aim for is 3-5% annual churn. That shakes out to well under 1% per month. But context is king here.
- Early-Stage Startups: If you're just starting out, don't sweat a higher churn rate. It's completely normal to see more customers leaving while you're still dialing in your product-market fit.
- Mature Companies: Once your customer base has stabilized, you should be laser-focused on getting that monthly rate as close to zero as humanly possible.
The ultimate goal for any SaaS business is to hit net negative churn. This is the holy grail. It happens when the new revenue you generate from existing customers (think upgrades and add-ons) outpaces the revenue you lose from cancellations.
Should I Calculate Churn Monthly or Annually?
The short answer? You need both. They serve two very different, but equally important, purposes.
Calculating your churn rate monthly gives you immediate, operational feedback. It’s your ground-level view, allowing your team to spot new trends, test retention strategies, and react quickly before small problems become big ones.
An annual churn rate, on the other hand, smooths out those monthly fluctuations and gives you a much better strategic overview. This is the 30,000-foot view you'll use for high-level planning, reporting to your board, and understanding the long-term health of the business.
One isn't "better" than the other—they're two sides of the same coin.
How Do I Handle New Customers in My Calculation?
This is a classic stumbling block. What happens if a customer signs up and cancels all within the same month? Do they count toward your churn for that period?
The cleanest and most widely accepted method is to only include customers who were active at the very start of the period.
So, if you're calculating churn for May, your starting pool is every customer who was active and paying on May 1st. Anyone who signed up on May 2nd or later isn't part of this specific calculation. This approach prevents new, potentially unqualified users from skewing your data and gives you a much clearer picture of how well you're retaining your existing customer base.
Getting your calculations right is a critical first step, but the real magic happens when you start predicting churn before it happens. For a deeper dive, check out our guide to customer churn prediction to learn how to spot at-risk users and intervene.
At Surva.ai, we turn feedback into your most powerful retention tool. Our AI-powered platform helps you understand exactly why customers churn and gives you the tools to stop it, from intelligent cancellation flows to personalized retention offers. Learn how Surva.ai can help you reduce churn and drive sustainable growth.
Sophie Moore
Sophie is a SaaS content strategist and product marketing writer with a passion for customer experience, retention, and growth. At Surva.ai, she writes about smart feedback, AI-driven surveys, and how SaaS teams can turn insights into impact.