What Are Good Survey Questions? 8 Important Types for 2025
Wondering what are good survey questions? Learn about 8 essential types like NPS and Likert scales to get actionable feedback for your SaaS business.

Are you planning a new survey? Wondering how to ask questions that give you clear, actionable answers? Many businesses send out surveys, but the quality of the feedback they get back depends entirely on the questions they ask. Generic questions lead to generic, unhelpful data. To really understand your customers, you need to know which type of question to use and when.
This guide breaks down what are good survey questions for SaaS companies. You'll learn what makes each question type powerful, see practical examples, and understand how to apply them to situations like measuring customer loyalty, gathering product feedback, and figuring out why customers leave. We'll look at 8 important question types that will help you collect feedback that drives real business decisions. Instead of just asking "How are we doing?", you'll learn to craft precise inquiries that deliver the specific insights you need to improve your product, reduce churn, and grow your business.
1. Net Promoter Score (NPS) Question
The Net Promoter Score (NPS) question is a foundation of customer feedback and one of the most effective survey questions you can ask. It measures customer loyalty with a single, direct query: "On a scale of 0-10, how likely are you to recommend our company/product/service to a friend or colleague?" This simple question provides a powerful, standardized metric for gauging customer sentiment over time.
Based on their response, customers are segmented into three distinct categories. This segmentation is important for understanding the health of your customer base. The infographic below provides a quick reference for these NPS categories.
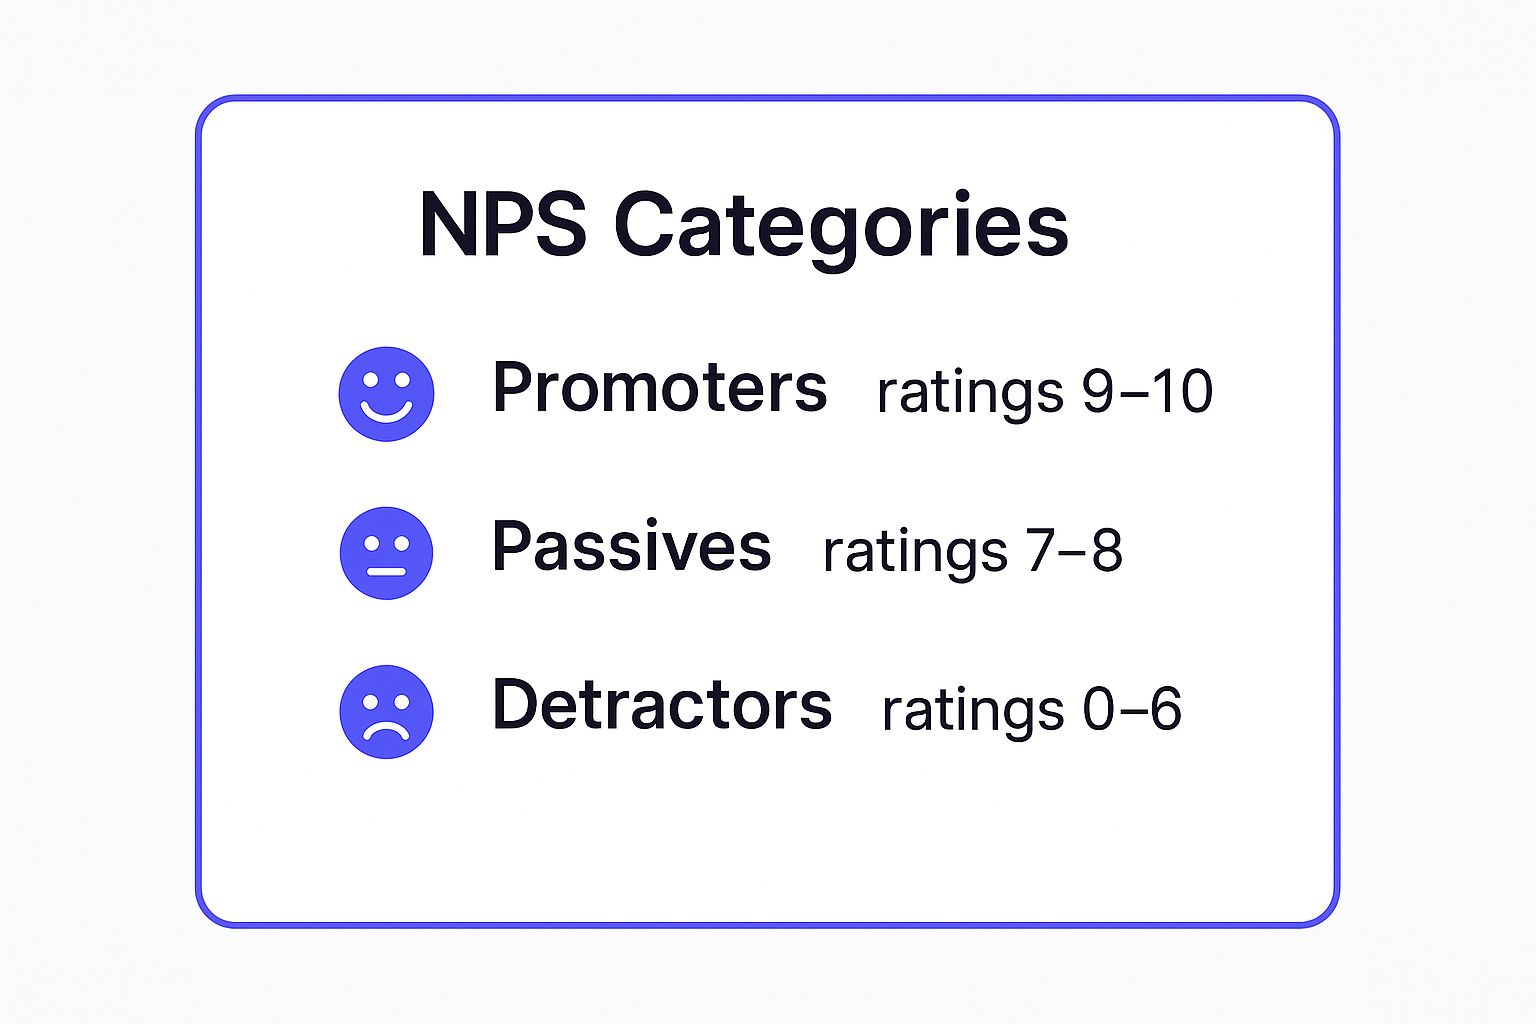
As shown, the wide range for Detractors (0-6) highlights how even a seemingly average score can signal significant customer dissatisfaction. Your final NPS is calculated by subtracting the percentage of Detractors from the percentage of Promoters, giving you a score from -100 to +100.
Strategic Breakdown & Actionable Takeaways
While the number itself is valuable, the real power of NPS is in the follow-up. Always pair the standard 0-10 question with an open-ended "why" question. This qualitative feedback is where you will find actionable insights to improve your product and customer experience.
- Act on Feedback Immediately: Create a "closed-loop" process. When a Detractor leaves feedback, have a customer success manager reach out personally to learn about the issue and offer a solution. This can turn a negative experience into a positive one.
- Segment Your Data: Don't just look at your overall score. Segment NPS by user persona, subscription plan, or feature usage. You might find that while your overall score is a healthy +40, your enterprise customers are Detractors, signaling a major churn risk.
- Track Trends, Not Just Scores: A single NPS survey gives you a snapshot. A series of surveys over time gives you a trend line. Companies like HubSpot use quarterly NPS surveys to monitor customer sentiment and measure the impact of their product updates and initiatives.
2. Likert Scale Question
The Likert scale question is a helpful tool for measuring attitudes and opinions with nuance. It moves beyond simple 'yes' or 'no' answers by asking respondents to indicate their level of agreement with a statement on a scale. A common example is: "The recent update to the user interface has made the software easier to navigate." with a 5-point scale from 'Strongly Disagree' to 'Strongly Agree'. This method quantifies subjective feedback, making it easy to analyze trends.
Developed by psychologist Rensis Likert, this question type is a staple in customer satisfaction, employee engagement, and product feedback surveys. The scale typically has an odd number of points (like 5 or 7) to include a neutral middle option, which can be just as insightful as a strong opinion. The image below shows a classic 5-point Likert scale in action.

The primary benefit of Likert scale questions is their ability to capture the intensity of a respondent's feelings. This provides richer, more detailed data than binary questions, helping you find out how much a customer agrees with a particular aspect of your service.
Strategic Breakdown & Actionable Takeaways
The effectiveness of a Likert scale depends on how you design the questions and interpret the results. The goal is to get specific, quantifiable feedback on distinct aspects of your business, which is a great way to find out what are good survey questions for your unique situation.
- Focus on Single Concepts: Avoid "double-barreled" questions. Instead of asking, "Was the onboarding process quick and helpful?", split it into two separate questions. One measures speed, the other measures helpfulness. This provides clear, actionable data for both your product and support teams.
- Maintain Scale Consistency: Use the same point scale (e.g., 5-point) and labels ('Strongly Disagree' to 'Strongly Agree') throughout a survey. This consistency makes it easier for users to respond quickly and for your team to analyze the collected data accurately.
- Analyze Beyond the Average: Don't just calculate an average score. Look at the distribution. If a question about a new feature shows 40% 'Strongly Agree' and 35% 'Strongly Disagree', it indicates a polarizing feature that delights some users while frustrating others. This signals a need for deeper investigation.
3. Open-Ended Question
Open-ended questions are survey items that allow respondents to answer in their own words, without the constraint of predefined options. By asking "how," "what," or "why," you invite detailed, qualitative feedback that reveals the thoughts, feelings, and motivations behind customer actions. This gives you access to a depth of insight that multiple-choice or scale-based questions simply cannot capture.

These questions serve as a direct channel to your user's mind, uncovering pain points, feature requests, and unexpected use cases. For example, a question like, "What is one thing we could do to make our product indispensable for you?" can yield more innovative ideas than a dozen structured questions combined. For more information, you can learn how to master open-ended research questions for better results.
Strategic Breakdown & Actionable Takeaways
The true value of open-ended questions comes from analyzing the raw, unfiltered voice of the customer. While this data is unstructured, modern tools can help you categorize and quantify themes, turning narrative feedback into strategic assets. For an extensive collection of questions designed to yield deep insights, refer to this strategic guide on 150+ Open-Ended Questions Examples.
- Be Specific to Get Relevant Answers: Avoid vague questions like "Any feedback?" Instead, ask a targeted question like, "What was the most difficult part of setting up your first project?" This directs the user's focus and provides more relevant, actionable data.
- Use AI for Thematic Analysis: Manually sifting through hundreds of text responses is inefficient. Use text analysis tools or AI-powered survey platforms to automatically tag responses with themes like "bug report," "feature request," or "usability issue," allowing you to quantify qualitative feedback.
- Limit and Position Strategically: Too many open-ended questions can cause survey fatigue and increase abandonment rates. Place one or two at the end of a survey, after the closed-ended questions, to capture final thoughts without disrupting the flow. Making them optional is also a good practice.
4. Multiple Choice Question (Single Answer)
The single-answer multiple choice question is a basic building block of effective surveys. It presents respondents with a list of predefined answer options and asks them to select the one that best fits their situation. This question type is one of the most common because it yields structured, quantitative data that is simple to tabulate and analyze, making it a powerful tool for gathering specific information.
This format forces a respondent to make a definitive choice, which is ideal for collecting clear-cut data on demographics, preferences, and behaviors. For example, a question like, "How did you first hear about our product?" with options such as "Search engine," "Social media," or "A friend" provides clean, easily segmentable data on acquisition channels.
Strategic Breakdown & Actionable Takeaways
The effectiveness of a multiple choice question depends entirely on the quality of its answer options. Poorly constructed choices can confuse respondents and invalidate your data. The goal is to create options that are both mutually exclusive (no overlap) and collectively exhaustive (all possibilities are covered).
- Make Options Mutually Exclusive: Each answer should be distinct. For an age question, use ranges like "18-24" and "25-34," not "18-25" and "25-35," which creates confusion for anyone who is 25. This precision is important for data integrity.
- Cover All Bases with 'Other': It's often impossible to list every potential answer. Including an "Other (please specify)" option acts as a safety net, capturing responses you didn't anticipate and providing valuable qualitative insights you might have otherwise missed.
- Prevent Position Bias: The order of your answers can influence responses. To mitigate this, randomize the order of options for each respondent. This prevents the first or last options from being chosen more frequently simply because of their position in the list. This is a standard feature in most modern survey tools.
5. Matrix/Grid Question
The Matrix or Grid question is an efficient way to ask multiple related questions that share the same answer scale. It presents a series of items in rows and a consistent set of rating options in columns, allowing respondents to evaluate several elements quickly within a single, organized table. This format is ideal for rating multiple product features or measuring satisfaction across various customer journey touchpoints.
These questions streamline the survey experience by consolidating similar queries, which prevents respondent fatigue and improves completion rates. The table structure also encourages comparative thinking, providing you with richer, more nuanced data on how different items stack up against each other.
Strategic Breakdown & Actionable Takeaways
While matrix questions are efficient, their design is important for collecting accurate data. A poorly constructed grid can confuse respondents and lead to unreliable answers. The goal is to make it easy for users to provide thoughtful feedback on multiple items without feeling overwhelmed. For a deeper look into making sense of this data, explore some best practices for analyzing survey data.
- Prevent Respondent Fatigue: Limit your matrix to a maximum of 5-7 rows. If you have more items to ask about, it is better to break them up into two separate, smaller grid questions. This keeps the question digestible and reduces the risk of users rushing through it.
- Optimize for Mobile: Always test how your matrix question appears on a mobile device. Long rows or numerous columns can create a poor user experience, forcing users to scroll horizontally. Check that the text is readable and the answer choices are easy to select on a smaller screen.
- Reduce Order Bias: The order in which you present items can influence responses. To mitigate this, randomize the order of the rows for each respondent. This makes sure that no single item benefits or suffers from its position in the list, leading to more objective data.
6. Ranking Question
Ranking questions are a powerful tool for finding out about priorities by asking respondents to order a list of items based on preference, importance, or value. Unlike rating questions where each item is judged independently, ranking forces a direct comparison. This question type makes respondents perform trade-offs, revealing a clear hierarchy of what they value most.
This method is exceptionally useful for prioritizing features, messages, or benefits. For example, a product team might ask users to "Rank these potential new features in order of importance to you." This provides direct, comparative data that is far more decisive than asking users to rate each feature on a 1-5 scale, where everything might end up rated as a '4' or '5'.
Strategic Breakdown & Actionable Takeaways
The true value of a ranking question is its ability to eliminate ambiguity in customer preferences. It moves beyond "what do you like?" to "what do you like most when you can only choose one top priority?". This clarity is invaluable for making strategic decisions with limited resources, a common scenario for any SaaS business.
- Focus on the "Why": A ranking shows you what users prioritize, but not why. Always add an open-ended follow-up question. Ask something specific like, "What made you choose [their #1 ranked item] as your top priority?" to find out the motivation behind their choice.
- Limit the Options: Presenting too many choices can lead to respondent fatigue and unreliable data. Limit your list to a maximum of 5-7 items. If you have a longer list, consider asking respondents to rank only their top 3 to keep the task manageable.
- Prevent Order Bias: The order in which you present items can influence how people rank them. Always randomize the initial order of the list for each respondent. This simple step makes sure that the first item displayed isn't disproportionately ranked higher simply due to its position.
7. Semantic Differential Question
The Semantic Differential Question measures the emotional or psychological perception of a concept, such as a brand, product, or feature. It works by presenting respondents with a scale anchored by two bipolar, or opposite, adjectives like "Modern" vs. "Outdated." Respondents then mark where their perception falls along this spectrum. This technique is excellent for capturing the nuanced, connotative meaning behind user attitudes.
Unlike a simple rating scale, this question format helps you map out brand perception and user experience on a deeper level. For instance, asking a user to rate a new feature on a scale of 1-5 for "ease of use" gives you a single data point. A semantic differential scale provides richer context by asking them to place it on a spectrum between "Simple" and "Complex" or "Intuitive" and "Confusing." This method reveals how users perceive the experience, not just if they liked it.
Strategic Breakdown & Actionable Takeaways
The value of the semantic differential question is in its ability to quantify subjective feelings. By collecting data across several adjective pairs, you can create a detailed "perceptual map" of your product or brand. This map visualizes how users feel and can even be used to compare your positioning against competitors.
- Map Your Brand and Competitors: Ask a segment of your target market to rate your brand and two key competitors across pairs like "Affordable vs. Premium," "Innovative vs. Traditional," and "Trustworthy vs. Unproven." Plot the average scores to visually identify your market position and find strategic gaps.
- Evaluate Feature Launches: After a new feature release, use semantic differential questions in a follow-up survey. Adjective pairs like "Essential vs. Unnecessary," "Fast vs. Slow," and "Integrated vs. Disjointed" will give your product team specific, actionable feedback on the user experience.
- Prevent Response Bias: To get more accurate results, randomize the order of the adjectives. Sometimes place the "positive" adjective on the left, and other times on the right. This prevents respondents from simply checking the same side of the scale for every question without thinking.
8. Customer Effort Score (CES) Question
The Customer Effort Score (CES) question is a powerful tool for measuring customer experience by focusing on ease of use. It directly asks, "To what extent do you agree or disagree with the following statement: The company made it easy for me to handle my issue?" Respondents typically use a 1-7 scale from "Strongly Disagree" to "Strongly Agree." This question zeroes in on the friction customers face, which is a key predictor of future loyalty.
The core idea, popularized by Gartner, is that reducing customer effort is more effective for building loyalty than trying to delight them. When a customer can resolve an issue, complete a purchase, or find information with minimal effort, they are more likely to remain a customer. CES is a transactional metric, best used immediately after a specific interaction to get a precise, in-the-moment reading of a user's experience.
Strategic Breakdown & Actionable Takeaways
While a high CES score is a positive sign, the true value comes from analyzing the feedback to pinpoint and eliminate friction in your processes. Pairing the scaled question with an open-ended follow-up like, "What made this process difficult?" is important for finding actionable insights to streamline the customer journey.
- Trigger Surveys at Key Moments: Automate CES surveys to send immediately after specific interactions. For example, send one after a customer support ticket is closed, a purchase is completed, or a user finishes an onboarding tutorial. This makes sure the experience is fresh in their mind.
- Segment by Interaction Type: Don't aggregate all your CES data into one number. Track scores separately for support interactions, product feature usage, and self-service help centers. This helps you identify which specific touchpoints are causing the most effort for customers.
- Focus on High-Effort Touchpoints: Prioritize improvements for interactions that consistently receive low CES scores. SaaS companies like Asana use feedback from low-effort scores to identify confusing UI elements or workflow gaps, directly informing their product development roadmap to make tasks simpler. You can learn more about how to effectively implement CES surveys and improve your customer experience.
Top 8 Survey Question Types Compared
Putting Your Questions to Work
You now have a complete toolkit of question types, from the directness of a Net Promoter Score question to the detailed feedback from an open-ended prompt. We have explored how Likert scales measure sentiment, how Customer Effort Score pinpoints friction, and how ranking questions reveal priorities. But figuring out what are good survey questions is only the first part of the equation. The real value comes from deploying them strategically to gather meaningful, actionable insights.
The most effective surveys are not just a random assortment of questions. They are carefully constructed conversations designed to achieve a specific goal. Think of yourself as a detective seeking clues. Your objective might be to find out the "why" behind user churn, to measure satisfaction after a new feature launch, or to identify your most valuable product attributes. Each objective requires a different combination of questions to uncover the full story.
From Questions to Actionable Insights
A great starting point is to focus on a single, high-impact goal. For example, instead of a broad "customer feedback" survey, create a targeted micro-survey to learn about the onboarding experience for new users.
Here’s a simple, effective combination you can use:
- Start with a quantitative question: Use a Customer Effort Score (CES) question like, "How easy or difficult was it to complete the initial setup?" This gives you a hard metric to track over time.
- Follow up with a qualitative question: Add an optional open-ended question like, "What was the most confusing part of the setup process?" This provides the context behind the CES score.
- Segment with a multiple-choice question: Ask, "Which of the following best describes your role?" to see if certain user personas are struggling more than others.
This focused approach prevents survey fatigue and delivers precise data you can act on immediately. You move beyond simply collecting data points and start building a direct feedback loop that informs your product roadmap, improves your support processes, and ultimately helps you build a better business. The goal of gathering these insights is to find practical ways to improve customer satisfaction and build loyalty.
Mastering the art of asking good survey questions transforms feedback from a passive activity into a proactive growth strategy. It gives your customers a voice and gives you a clear path forward.
Ready to turn these insights into action? Surva.ai helps you create and deploy intelligent, contextual surveys at the perfect moment in the customer journey. Stop guessing and start listening by building targeted feedback loops that drive growth. Try Surva.ai today and see how easy it is to ask the right questions.
Sophie Moore
Sophie is a SaaS content strategist and product marketing writer with a passion for customer experience, retention, and growth. At Surva.ai, she writes about smart feedback, AI-driven surveys, and how SaaS teams can turn insights into impact.