What Is a Good Survey Response Rate
Wondering what is a good survey response rate? This guide covers industry benchmarks, key factors, and practical tips to help you get more valuable feedback.

There isn't a single magic number for a "good" survey response rate. You might hear 30% mentioned as a solid benchmark, but the real answer is always, “it depends.”
What counts as a good rate depends on your survey’s goals, who you’re asking, and how you’re asking. The key is to understand the context so you can set realistic expectations from the beginning.
Defining a Good Survey Response Rate

Your survey response rate is the percentage of people who finished your survey out of the total number you invited.
Imagine a restaurant manager wants feedback on a new menu. If she asks 100 diners for their thoughts and only 5 reply, she can’t be too sure if their opinions represent everyone. But if 30 diners respond? Now she can have much more confidence in the results.
This number reflects how engaged your audience is and how well your outreach worked. A higher rate usually means the data you have collected is more likely to be a true snapshot of the entire group you are interested in.
General Benchmarks By Method
The way you send out your survey will greatly impact the kind of response rate you can expect. For instance, a personal, face to face request will almost always get more replies than a generic email blast that lands in a crowded inbox.
To give you a rough idea, here are some typical ranges you can expect based on your distribution method.
| General Survey Response Rate Benchmarks |
| :--- | :--- | :--- | :--- |
| Survey Method | Typical Low End | Average Rate | Excellent Rate |
| Face-to-Face Surveys | 30% | 57% | 70%+ |
| SMS (Text Message) Surveys | 25% | 40-50% | 60%+ |
| Email Surveys | 10% | 15-25% | 30%+ |
| Website Feedback Tabs | 1% | 3-5% | 10%+ |
These numbers are a great starting point, but remember they are just general guidelines. Your specific audience and industry will play a huge role.
A good survey response rate gives you confidence that your findings are not just random noise. It helps you be sure that the business decisions you make based on the data are sound and truly reflect your audience's views.
Your goal is to gather enough reliable information to make smart, informed decisions. Now that you have a baseline, we can dig into what these numbers actually mean for your business and how you can start improving them.
Why Survey Response Rates Actually Matter
Your survey response rate directly reflects how much you can trust the data you are collecting. A high response rate gives you confidence that the feedback you have gathered is a solid foundation for making real business decisions.
Why? Because a strong response rate helps you dodge something called nonresponse bias. This is a sneaky problem that crops up when the people who do not answer your survey have different opinions from the ones who do. If you only hear from a tiny, vocal fraction of your audience, your data can get skewed, fast.
The Danger of Acting on Bad Data
Imagine a SaaS company that is thinking about building a shiny new feature. They send out a survey to all their users but only get a 5% response rate. The folks who did respond are super enthusiastic and cannot wait for the new feature.
Based on this sliver of feedback, the company sinks thousands of dollars and hundreds of hours into development. But when they finally launch it, the reception is lukewarm at best. It turns out the silent majority was either indifferent or actively disliked the idea, but their voices were never heard.
A strong survey response rate helps you make better business decisions. It gives you a much clearer picture of reality, which is exactly what you need to build products people love and forge stronger customer relationships.
In short, a low response rate can lead to expensive missteps. By focusing on getting more people to reply, you are gathering more accurate insights. And that accuracy is what separates a genuinely useful survey from one that could steer your business off a cliff. Getting to know your customers always starts with better data.
Response Rate Benchmarks by Survey Type

The kind of survey you are running will massively shift your expectations for a "good" response rate. Let’s be honest, not all surveys are created equal. The single biggest factor is often the relationship you already have with your audience and how invested they are in the outcome.
Think about it. Surveys sent internally to your own employees almost always get higher engagement. They have a vested interest in the company and feel a sense of connection, which is why these surveys often see response rates between 30% and 50%. You have a built in motivation that is tough to find anywhere else.
On the flip side, customer satisfaction surveys sent out to a broad, external audience tend to see lower numbers. For these, a realistic target is somewhere in the 10% to 30% range. Your customers are busy people with crowded inboxes, so you are competing for just a sliver of their attention. For a more detailed look, you can look into specific survey response rate benchmarks to help set the right goals.
Specialized Fields and Highly Motivated Audiences
Some fields are just naturally going to pull in higher engagement because the participants have a powerful reason to respond. Healthcare and academic research are perfect examples. When people feel their feedback could directly improve their medical care or contribute to an important study, their motivation goes way up.
For instance, patient and healthcare professional surveys can vary wildly depending on the location and method. One global analysis found patient surveys hit an average 70% response rate, while surveys for doctors came in lower at 53%. It just goes to show how personal investment changes everything.
A "good" response rate is less about hitting a magic number and more about knowing your specific audience and goals. An internal employee survey that gets a 40% response rate is fantastic. A cold customer survey that pulls in 15% could be a huge win, too.
The key is setting realistic targets for your unique project. Here’s a quick breakdown of what you might expect:
- Internal Employee Surveys: Expect higher rates, typically 30-50%. The audience has a direct relationship with your organization.
- External Customer Surveys: Aim for 10-30%. It takes more effort to capture the attention of a less-invested audience.
- Specialized Research (e.g., Healthcare, Academia): Can see rates of 50% or higher because the participants are highly motivated by the subject matter.
Setting the right expectations from the beginning is the best way to accurately measure the success of your survey efforts.
Key Factors That Influence Your Survey Responses
Ever wonder why one survey gets tons of replies while another one flops? It’s not just luck. Several variables can either supercharge or sink your participation rate, and knowing what they are is half the battle. While you cannot control everything, a lot of key elements are in your hands.
Think of it this way: when you design a survey, you are asking for someone's time. The easier and more rewarding you make that experience, the more likely they are to say yes.
One of the biggest deal breakers is the survey's length. People are busy. A long, complicated survey feels like a pop quiz nobody signed up for. That’s why shorter, punchier surveys almost always win out. They show you respect the respondent's time.
Just look at how quickly people drop off as you add more questions.
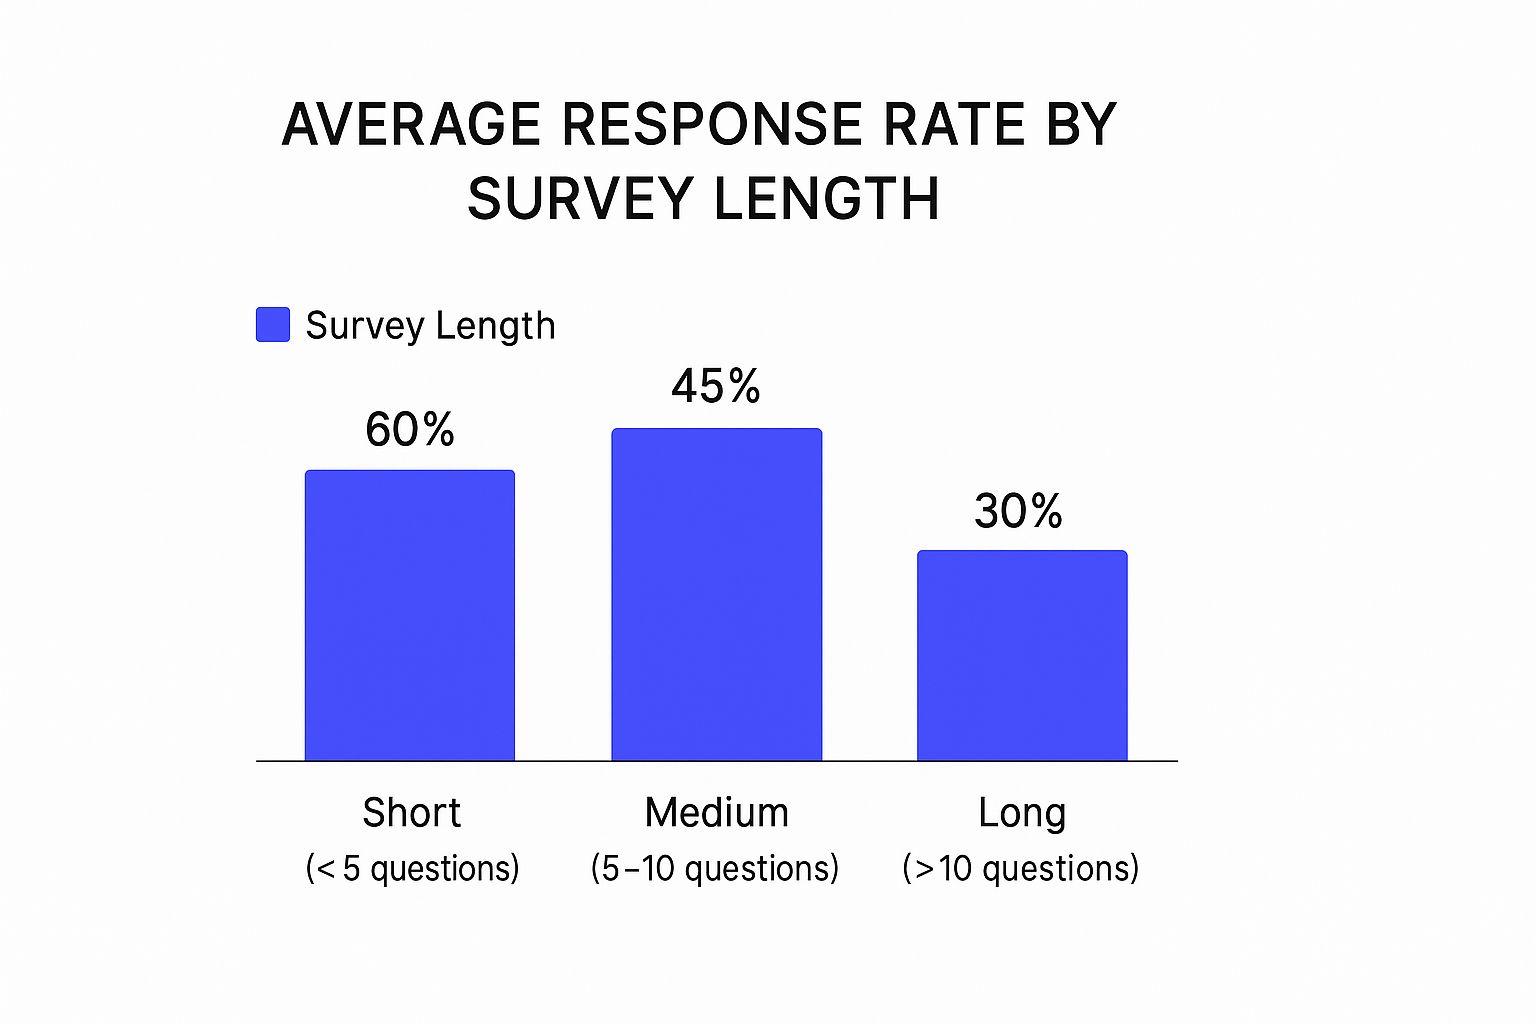
The data does not lie. Keeping your survey under five questions can literally double your response rate compared to one with over ten. It’s a massive difference.
Question Design and Audience Relationship
How you ask the questions is just as important as the length. Are they crystal clear? Easy to follow? Actually relevant to the person you are asking? Throwing in confusing jargon or poorly worded questions is a surefire way to get people to click away mid survey.
Your relationship with your audience also plays a huge role.
- Highly engaged customers who already love your brand are way more likely to give you their feedback. They feel a connection.
- A cold audience that has never heard of you? They will naturally be more hesitant to participate.
Building a real relationship with your audience before you need something from them is one of the best investments you can make. It builds the trust needed for them to give you their time and honest feedback when you ask.
The Role of Incentives
Finally, let's talk about the carrot on the stick: incentives. Offering a little something for their time can definitely boost participation, but you have to be smart about it.
A small, guaranteed reward like a $5 gift card often works better than a lottery style chance to win a big prize. Why? Because a sure thing feels more tangible and shows you value their time.
Just be careful. The wrong incentive can attract people who just want the prize and will rush through the questions without giving thoughtful feedback. The trick is to match the incentive to your audience and the effort they need to put in.
To wrap it up, a lot of different elements, some big, some small, come together to determine your survey's success.
Here's a quick table summarizing how these different factors can push your response rates up or down.
How Different Factors Impact Response Rates
Knowing these dynamics is key. By consciously designing your survey with these factors in mind, you can stop leaving your response rates to chance and start getting the valuable data you need.
How Your Survey Method Impacts Response Rates

The way you send out your survey can make or break your response rate. Think about it: each method you choose (email, in person, phone) comes with its own set of rules and expectations. Picking the right one is all about knowing your audience and the context of your ask.
Email surveys are a popular choice for a reason. They’re cheap, fast, and let you reach a massive audience without breaking a sweat. The biggest hurdle? The inbox itself. Your survey is just one of dozens, if not hundreds, of emails your audience gets every day. Cutting through that clutter to grab someone's attention is a real challenge. A great way to boost engagement is by embedding the first question directly in the email body, which you can learn more about in our guide to surveys embedded in email.
On the other end of the spectrum, you have in person surveys. These almost always pull in the highest response rates. When you’re face to face, it’s much harder for someone to just walk away. That personal connection builds instant rapport. But let’s be real, this approach is slow and expensive, making it completely impractical for most large scale projects.
The Shifting Tides of Survey Channels
What works today might not work tomorrow. Survey channels are constantly evolving with technology and our own habits. Just look at telephone surveys. They used to be the gold standard for gathering data, but their effectiveness has tanked over the years.
Back in 1997, a Pew Research Center telephone survey could expect a solid 36% response rate. Fast forward to 2018, and that number plummeted to a mere 6%. It’s a stark reminder of how quickly a reliable method can fade as people start screening calls and adopting new ways to communicate.
Choosing the right channel is about meeting your audience where they already are. A quick text survey might be perfect for a younger crowd, while a more formal email is probably a better fit for a B2B audience.
When you get a feel for these differences, you can start setting realistic goals for what a "good" response rate actually looks like for your specific survey. Nailing the delivery method is the first big step to getting the quality feedback you’re after.
Practical Tips to Improve Your Survey Response Rate
Knowing what a "good" survey response rate looks like is one thing. Actually hitting that number? That’s a completely different ballgame.
Getting more people to complete your surveys usually comes down to a series of small, intentional choices that make the entire experience better and more respectful for your audience. Here are a few proven strategies you can put into practice right away.
First off, be upfront about the survey's purpose and how long it’ll take. People are way more likely to jump in when they know why you are asking and see that you value their time. A simple, honest intro like, "Help us improve our onboarding, this will only take 3 minutes," sets clear expectations from the beginning.
Nail Your Invitation and Timing
The way you ask someone to take a survey really matters. A generic, mass blasted email is easy to ignore, but one that uses the recipient's name feels more direct and important. You can take this a step further by referencing a recent interaction, like a purchase they made or a support ticket they closed. Personalization is your best friend here.
When you send that invitation is just as critical. A few tweaks to your timing can make a huge difference.
- A/B Test Your Subject Lines: Do not just guess what will grab someone's attention. Test a few different email subject lines to see which ones get the highest open rates.
- Send a Well-Timed Reminder: Life gets busy. A single, friendly follow up email sent a few days after the first one can capture responses from people who simply did not have a moment the first time around.
- Make it Mobile-Friendly: A massive chunk of your audience will open your survey on their phone. If the layout is clunky or the text is hard to read on a small screen, they’ll bail immediately.
And when you are sending email surveys, your invitation actually needs to make it to the inbox. Following essential email deliverability best practices makes sure your hard work doesn’t just get lost in a spam folder.
One of the most effective ways to boost participation is to show respondents you value their input. This is not just about offering an incentive; it's about making the entire process feel respectful, relevant, and easy.
Improving your numbers comes down to a mix of good psychology and smart execution. For more ideas, check out our guide with more tips to increase your survey response rate and turn that feedback into a powerful asset. By focusing on these practical steps, you can move beyond just hoping for good results and start actively creating them.
Common Survey Response Rate Questions
Even with the best strategy in place, a few questions about survey response rates always seem to pop up. Let's tackle some of the most common ones so you can feel more confident heading into your next survey project.
Is a Low Response Rate Always Bad?
Not necessarily. Sometimes, it is the quality of your responses that counts, not the sheer quantity.
Think of it this way: if you survey 1,000 customers and only 50 respond, that number might feel a bit disappointing. But what if all 50 of those people are your "power users"? Their detailed, expert feedback could be pure gold for making specific product decisions.
The real key is to dig into who actually responded. Always take a moment to analyze the demographics of your respondents to see if they represent a specific, and important, slice of your audience.
How Do I Calculate My Response Rate?
Figuring out your response rate is simple. You just need two numbers to get started.
The formula is pretty straightforward:
(Number of Completed Surveys ÷ Total Number of People Invited) x 100 = Your Response Rate %
So, if you sent a survey link to 500 people and 150 of them completed it, your response rate would be 30%. This simple metric is your baseline for measuring how well your outreach is working.
When Is the Best Time to Send a Survey?
There is no magic bullet that works for everyone; the perfect time really depends on who you are trying to reach. That said, there are some general guidelines that tend to deliver better results.
- For B2B audiences, try sending surveys during the work week. Tuesday or Wednesday mornings are often a sweet spot before schedules get too hectic.
- For B2C audiences, evenings or weekends can perform better. You are more likely to catch people when they have a little downtime.
The best approach? Test it out. Send your survey at different times to a small segment of your list. See what gets the most engagement for your unique group, and then use that data to guide your main send.
Ready to turn feedback into growth? Surva.ai gives SaaS teams the tools to build surveys that get responses, reduce churn, and collect powerful testimonials. Learn how Surva.ai can help you.
Sophie Moore
Sophie is a SaaS content strategist and product marketing writer with a passion for customer experience, retention, and growth. At Surva.ai, she writes about smart feedback, AI-driven surveys, and how SaaS teams can turn insights into impact.