Top 6 Examples of Survey Reports to Boost Your SaaS Strategy
Discover 6 practical examples of survey reports to improve your SaaS business insights. Learn how to leverage these examples of survey reports effectively.

Collecting feedback is just the first step. The real value comes from how you present and analyze that data. A well-structured survey report turns raw numbers and comments into a clear roadmap for your SaaS team, showing you exactly where to focus your efforts. It helps you spot trends, figure out user sentiment, and make informed decisions that reduce churn and build a better product.
This guide breaks down six different examples of survey reports, offering practical templates and tactical advice you can apply right away. We will look at how to structure each one, what to include, and how to pull out insights that lead to meaningful action. Turning raw data into growth starts with gathering the right information, which is why employing top audience research methods is so foundational.
By the end, you'll have a solid framework for creating reports that your team will actually read and use to drive product improvements, boost customer loyalty, and make smarter strategic bets. We’ll show you how to move beyond simple data dumps and create documents that inspire change.
1. Customer Satisfaction Survey Report
A Customer Satisfaction Survey Report is a foundational tool for any SaaS business looking to gauge how happy users are with its products or services. These reports consolidate customer feedback to identify strengths, find user pain points, and provide clear direction for improving the overall customer experience. They transform raw data from surveys into strategic business intelligence.
Effective satisfaction reports often center on a few core metrics that provide a quick yet powerful pulse on customer sentiment. This data helps teams track performance over time and benchmark against competitors.
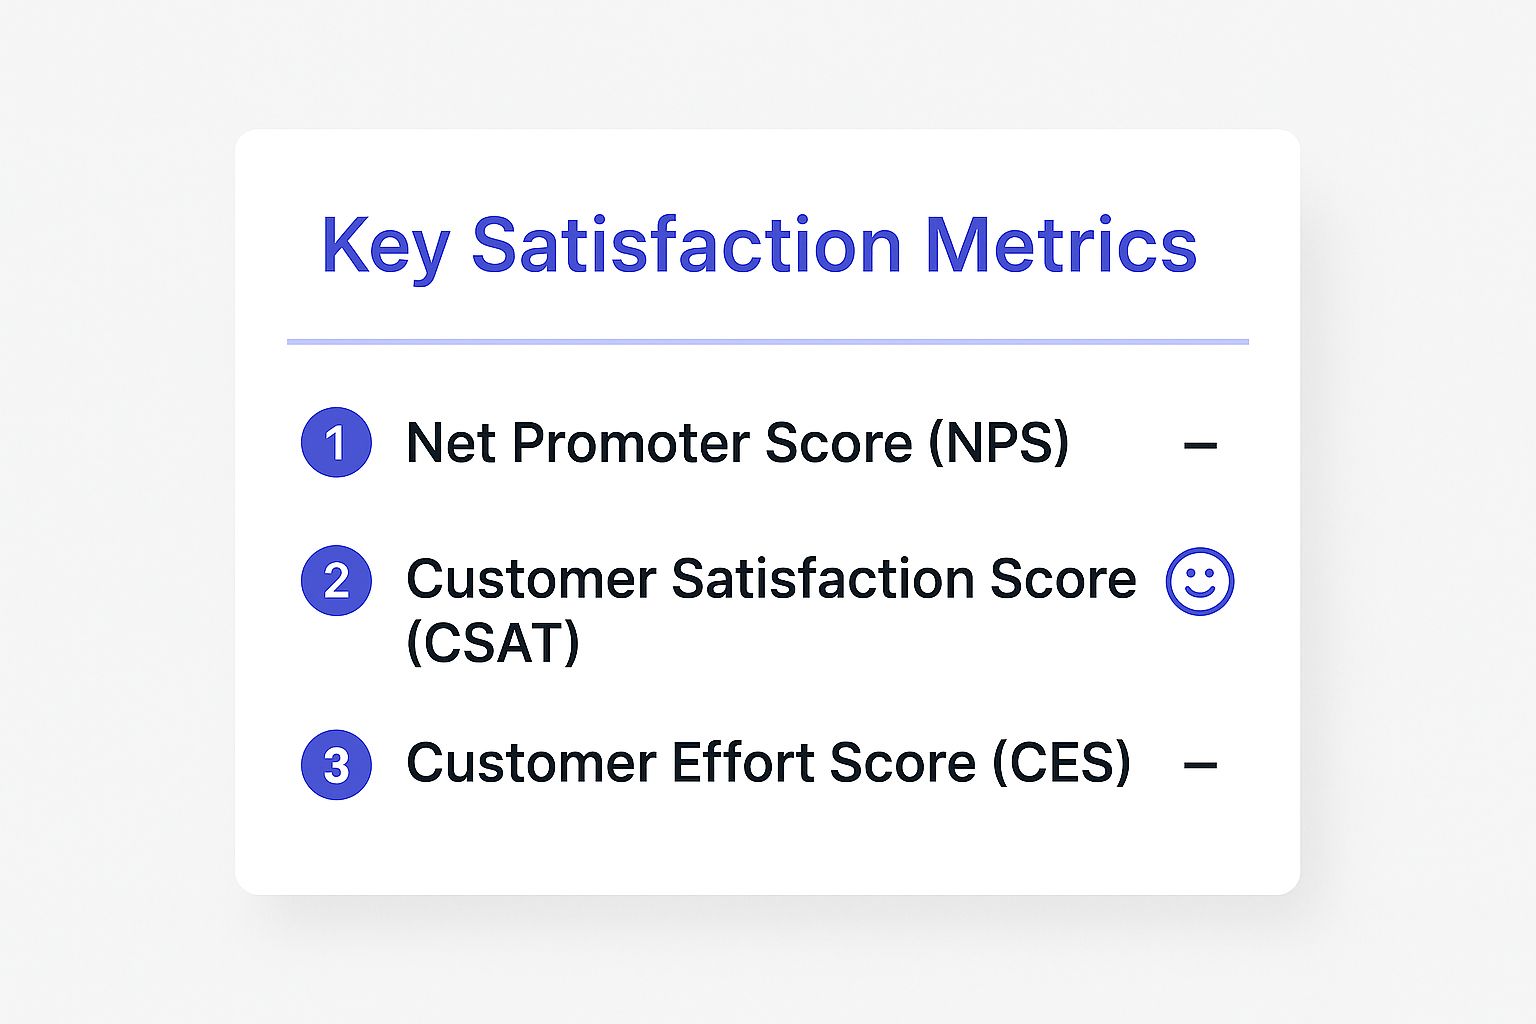
These three metrics, NPS, CSAT, and CES, form the backbone of many successful feedback programs, from Amazon's post-purchase surveys to Airbnb's host and guest experience reports.
Strategic Breakdown and Application
The primary goal of a satisfaction report is to drive action, not just measure sentiment. For example, a low CSAT score for a specific feature might trigger a product team to prioritize its redesign. Similarly, a high CES score could indicate friction in the onboarding process, prompting the customer success team to create better support documentation.
Actionable Takeaways for Your Team
To create impactful examples of survey reports focused on satisfaction, implement these tactics:
- Segment Your Data: Analyze feedback based on user personas, subscription tiers, or lifecycle stage. This reveals how different groups experience your product.
- Combine Quantitative and Qualitative Data: Use rating scales (like CSAT) to measure what customers feel and open-ended questions to learn why they feel that way.
- Implement a Closed-Loop System: When a customer provides negative feedback, have a process to follow up, resolve their issue, and "close the loop." This shows you are listening and can turn detractors into advocates.
By consistently collecting and analyzing this feedback, you build a robust voice of the customer program that directly influences your product roadmap and growth. To see more detailed voice of the customer examples, you can explore different ways companies apply these principles. Beyond just reporting on customer sentiment, exploring resources on how AI can boost customer satisfaction might provide further insights for action.
2. Employee Engagement Survey Report
An Employee Engagement Survey Report is a key organizational tool used to measure workforce satisfaction, motivation, and overall connection to the company's mission. These reports synthesize employee feedback to diagnose the health of the workplace culture, identify potential retention risks, and inform strategies that boost productivity and reduce turnover. They convert raw employee sentiment into clear, actionable organizational insights.

Effective engagement reports focus on key drivers like leadership effectiveness, career growth opportunities, work-life balance, and recognition. This data helps HR and leadership teams monitor the employee experience over time and benchmark their culture against industry standards. Pioneering examples include Google's Project Oxygen, which studies manager effectiveness, and Microsoft's use of daily pulse surveys for continuous feedback.
Strategic Breakdown and Application
The primary function of an employee engagement report is to spark meaningful change, not just to collect data. For instance, low scores in the "career development" category might lead leadership to invest in new training programs or create clearer paths for internal promotion. Similarly, feedback indicating burnout could prompt a review of workload distribution and flexible work policies. These reports provide the evidence needed to justify and prioritize people-focused initiatives.
Actionable Takeaways for Your Team
To create impactful examples of survey reports centered on employee engagement, implement these tactics:
- Promise Anonymity and Transparency: Guarantee complete confidentiality to encourage honest and unfiltered feedback. After the survey, transparently communicate the high-level results and intended next steps to the entire organization to build trust.
- Segment Data for Deeper Insights: Analyze survey results by department, role, or tenure. This can uncover specific issues affecting certain teams, such as a lack of resources for the engineering team or poor onboarding for new hires.
- Create Concrete Action Plans: For every key issue identified, develop a specific action plan with a clear owner, timeline, and measurable goal. Follow up with pulse surveys between annual reports to track progress on these initiatives and maintain momentum.
By regularly collecting and acting on this feedback, you cultivate a more positive and productive workplace culture. You show employees that their voices are heard and valued, which directly influences retention and overall business performance. For those looking to build out their programs, platforms like Culture Amp offer specialized tools and benchmarks for measuring engagement.
3. Market Research Survey Report
A Market Research Survey Report is a strategic business intelligence document that analyzes consumer behavior, market trends, competitive environment, and buying decisions. Teams use these reports to guide product direction, refine marketing strategies, set pricing, and plan expansion into new regions or segments.

These reports start with clear research goals, such as measuring brand awareness or tracking purchase drivers. Data comes from surveys sent to a representative sample of customers or prospects. Leaders at Nielsen, Ipsos, YouGov, and Kantar combine charted results on trend shifts with open feedback quotes. Gartner’s IT spending surveys and McKinsey’s consumer sentiment studies show how this mix of numbers and narrative guides executive decisions.
Strategic Breakdown and Application
A focused market report pinpoints shifts before they become major threats or missed chances.
- Representative sampling: Use demographic quotas or stratified samples to mirror your target audience.
- Mixed methods: Combine rating scales for broad measures with open questions for nuance.
- Comparative analysis: Benchmark results against past waves or industry peers.
- Trend spotting: Map changes in preference or price sensitivity over time.
For example, Nielsen’s consumer behavior report for CPG brands highlights buy–reuse–recommend patterns across age groups. PwC’s CEO survey reveals how leadership intent changes around investment or hiring when economic conditions shift. These case studies show how data can shape marketing budgets or R&D roadmaps.
Gather fresh data each quarter so you can act on minor shifts before they become major roadblocks.
Actionable Takeaways for Your Team
- Define what decisions will be based on this report
- Blend online questionnaires with small-group interviews for extra insight
- Crosscheck survey data against social listening or sales figures
- Run shorter pulse surveys to keep pace with fast-moving markets
Learn more about Market Research Survey Report on surva.ai to see data analysis methods that fit each phase of your project.
4. Academic Research Survey Report
An Academic Research Survey Report is a scholarly document that presents findings from systematic data collection. It is designed to test hypotheses, explore relationships between variables, or describe phenomena within a specific field of study. These reports adhere to rigorous academic standards, transforming raw survey data into verified knowledge that contributes to a broader academic discipline.
Unlike business-focused reports, the primary audience for academic reports is other researchers, scholars, and policymakers. The emphasis is on methodological rigor, statistical validity, and the clear articulation of how the findings confirm or challenge existing theories. They serve as a cornerstone for building cumulative knowledge.
Prestigious organizations like the Pew Research Center, which produces in-depth studies on social trends, and academic publications like the Journal of Marketing Research are prime examples of this report type. Their work often influences public discourse and business strategy by providing validated, impartial data.
Strategic Breakdown and Application
The main objective of an academic research survey report is to produce objective, generalizable insights. The process is meticulous, starting from a literature review to identify gaps in knowledge, followed by hypothesis formulation, survey design, data collection, and finally, rigorous statistical analysis. Each step is documented transparently to allow for peer review and replication.
For a SaaS company, the principles behind these reports can be adapted for deep-dive market research or user behavior studies. For instance, a company could use this structured approach to investigate the correlation between user onboarding effectiveness and long-term retention, applying statistical tests to validate their findings beyond simple observation.
Actionable Takeaways for Your Team
To create credible examples of survey reports with an academic approach, implement these tactics:
- Follow Established Methodologies: Structure your survey and analysis using recognized research principles. This includes defining your population, using appropriate sampling methods, and choosing the right statistical tests for your data.
- State Limitations and Biases: A hallmark of academic integrity is acknowledging the study's limitations. Clearly state potential biases, constraints on your sample size, or other factors that could influence the results. This builds credibility and provides context.
- Prioritize Ethical Considerations: Obtain informed consent from participants. Anonymize data to protect privacy and be transparent about how the information will be used. A well-crafted introduction is key, and you can find guidance on how to create one in these examples of survey introductions.
By adopting the discipline of academic research, your team can produce highly reliable and defensible insights that provide a solid foundation for major strategic decisions.
5. Political Opinion Poll Report
A Political Opinion Poll Report is a systematic measurement of public opinion on candidates, issues, or current events. These reports analyze data from carefully selected samples of the population to provide insights into voter preferences and societal attitudes. For SaaS companies, especially those in the GovTech or public advocacy sectors, reviewing these reports offers a masterclass in trend analysis and audience segmentation.
Effective opinion polls provide a snapshot of public sentiment at a specific moment. They often track key metrics like presidential approval ratings or voter preferences, allowing campaigns and organizations to measure shifts in opinion over time and adjust their strategies accordingly.
Strategic Breakdown and Application
The core purpose of a political poll report is to inform strategy by predicting public behavior. For example, a candidate might use polling data showing high voter concern about the economy to focus their messaging on economic policy. Similarly, a non-profit organization can use reports on public attitudes toward environmental regulations to shape its advocacy campaigns for maximum impact.
These reports demonstrate the power of longitudinal data analysis. Trend lines are often more important than the results of a single poll. Renowned examples include the Gallup presidential approval ratings, which have tracked public sentiment for decades, and the detailed election polling from sources like the Pew Research Center, CNN, and ABC News.
Actionable Takeaways for Your Team
While your SaaS business may not be running for office, the methods behind these examples of survey reports are highly applicable. To create insightful reports modeled on political polling, implement these tactics:
- Focus on Trend Direction: Instead of overreacting to a single data point, track key metrics over time. A gradual decline in user satisfaction with a core feature is a more reliable signal for action than one bad survey response.
- Know Your Sample: Political polls pay close attention to demographics and sample sizes to confirm their data is representative. Segment your user feedback by persona, company size, or plan type to get a more accurate picture of different user groups.
- Acknowledge a Margin of Error: No survey is perfect. Recognize that your results have a margin of error. Use confidence intervals to communicate the reliability of your data to stakeholders and avoid making big decisions based on small, statistically insignificant changes.
By adopting these polling principles, your team can move beyond simple feedback collection. You can begin to forecast user behavior, identify emerging trends, and make data-informed strategic decisions that resonate with your target audience.
6. Healthcare Patient Experience Survey Report
A Healthcare Patient Experience Survey Report provides a comprehensive assessment of patient interactions with healthcare providers. These reports measure satisfaction with care quality, communication effectiveness, facility conditions, and the overall treatment experience. They are important for regulatory compliance, quality improvement initiatives, and building patient trust.
These reports translate complex patient feedback into clear, actionable data. Hospitals and clinics use this information to pinpoint service gaps and improve patient outcomes, a process important for organizations like the Mayo Clinic and those adhering to HCAHPS standards.

Standardized surveys like the HCAHPS (Hospital Consumer Assessment of Healthcare Providers and Systems) in the US and the NHS Patient Experience surveys in the UK are prominent examples. These frameworks allow for consistent data collection and benchmarking across the industry.
Strategic Breakdown and Application
The core purpose of a patient experience report is to drive measurable improvements in care delivery. For instance, low scores in the "Communication with Doctors" category might lead a hospital to implement new communication training protocols for its medical staff. Similarly, negative feedback about wait times could prompt a review of scheduling and patient flow processes.
These reports directly influence a provider's reputation and financial health, as patient satisfaction scores are often publicly reported and tied to reimbursement models. Organizations like Press Ganey specialize in helping providers collect and analyze this data to achieve operational excellence.
Actionable Takeaways for Your Team
To develop effective examples of survey reports focused on patient experience, consider these strategies:
- Optimize Survey Timing: Send surveys soon after a patient's discharge or appointment, while the experience is still fresh in their mind. This improves the accuracy and detail of the feedback.
- Use Multiple Channels: Distribute surveys through various channels, such as email, SMS, or interactive voice response (IVR), to maximize response rates across different patient demographics.
- Implement Real-Time Feedback: Use point-of-care tablets or QR codes in waiting rooms to capture immediate feedback. This allows for rapid service recovery and demonstrates a commitment to listening.
By systematically gathering and acting on patient feedback, healthcare organizations can create a patient-centric culture that improves both satisfaction and clinical results.
Survey Report Types Comparison
Report TypeImplementation Complexity 🔄Resource Requirements ⚡Expected Outcomes 📊Ideal Use Cases 💡Key Advantages ⭐Customer Satisfaction Survey ReportModerate: Requires consistent methodology and survey designMedium to High: Needs survey tools and analysis resourcesImproved customer loyalty, actionable business insightsImproving product/service quality and customer retentionDirect impact on revenue and retention; clear ROIEmployee Engagement Survey ReportModerate: Anonymity and follow-up actions are keyMedium: Requires confidential survey platforms and HR involvementReduced turnover, increased productivity, better cultureImproving workplace culture and reducing employee churnIdentifies leadership needs; promotes inclusivityMarket Research Survey ReportHigh: Complex sampling, multiple methodsHigh: Often costly with broad data collection needsData-driven strategic decisions, market opportunity identificationProduct launches, market entry, marketing optimizationHelps de-risk decisions; uncovers new opportunitiesAcademic Research Survey ReportHigh: Rigorous protocols, peer reviewHigh: Extensive time and advanced statistical toolsTheoretical contributions, evidence-based findingsScholarly research, hypothesis testing, theory buildingHigh validity and reliability; peer-reviewed workPolitical Opinion Poll ReportModerate to High: Sensitive timing and samplingMedium to High: Requires representative samples and quick analysisReal-time public opinion trends and campaign insightPolitical campaigns, media reporting, policy decisionsInfluences campaigns; informs public discourseHealthcare Patient Experience Survey ReportModerate: Compliance with regulations and proper timingMedium: Requires coordination with healthcare staffImproved patient care quality and regulatory complianceHealthcare quality improvement and reimbursement programsDirect impact on care quality; tied to reimbursements
Turn Your Feedback into a Growth Engine
We have explored a variety of powerful examples of survey reports, from tracking customer satisfaction to gauging employee engagement and researching new markets. Each example reinforces a central idea: a great survey report is not a static document but a catalyst for strategic action. It translates raw data into a clear narrative that guides decision making.
For SaaS teams, this distinction is everything. A report that simply lists NPS scores or satisfaction ratings is a missed opportunity. The true value comes from connecting that feedback to core business metrics. When you can see how a specific product friction point impacts churn, or how a positive onboarding experience correlates with higher user activation, you transform feedback from a simple observation into a predictive tool for growth.
Key Principles for Effective Reporting
Throughout the examples, several key principles emerged. Mastering these will elevate your own reporting from basic summaries to indispensable business intelligence assets.
- Segmentation is Strategy: As seen in the customer satisfaction and market research examples, dividing your respondents into meaningful groups is important. Segmenting by user persona, subscription tier, or product usage behavior reveals the nuances that a high-level overview can obscure.
- Qualitative Data Holds the 'Why': The employee engagement and patient experience reports highlighted the importance of open-ended feedback. Quantitative data tells you what is happening, but qualitative comments explain why. Use text analysis to find recurring themes and direct quotes to build empathy and drive change.
- Visuals Drive Clarity and Action: Every strong report example used charts, graphs, and clear formatting to make complex information digestible. Your goal is to help stakeholders quickly identify key findings and learn their implications without needing to sift through dense tables of numbers. A well-designed visual can communicate a trend more effectively than a paragraph of text.
From Insights to Impact
The ultimate purpose of any survey report is to spark meaningful change. The most effective reports do not just present findings; they recommend specific, actionable next steps. This closes the loop between collecting feedback and improving your product, service, or organization. Instead of just stating that "users find the new dashboard confusing," a strong report might suggest, "A/B test a revised dashboard layout focused on simplifying the primary user workflow, with a goal of reducing support tickets for this feature by 30%."
By adopting the structures and strategic approaches from these examples of survey reports, you can build a consistent, scalable process for listening to your audience. This turns feedback from an occasional project into a continuous, automated engine for improvement. The result is a more customer-centric product, a more engaged team, and a business that adapts quickly to market demands.
Ready to transform your feedback process? Surva.ai uses AI to automate the analysis and reporting for you, turning raw survey responses into actionable insights in seconds. Get started for free and build your first intelligent survey report today at Surva.ai.
Sophie Moore
Sophie is a SaaS content strategist and product marketing writer with a passion for customer experience, retention, and growth. At Surva.ai, she writes about smart feedback, AI-driven surveys, and how SaaS teams can turn insights into impact.