A Practical Guide on How to Measure Customer Engagement
Learn how to measure customer engagement with this practical guide. Discover the key metrics, tools, and real-world strategies to improve user retention.

To measure customer engagement, you have to look beyond surface-level numbers and get into the quality and depth of the interactions a customer has with your business. This means identifying the key actions they take, like using a core feature, making repeat purchases, or submitting feedback. You then connect those actions to metrics that give you a real sense of customer health, loyalty, and churn risk.
What Is Customer Engagement

Customer engagement is the ongoing relationship between a customer and your business, built one interaction at a time. It’s the difference between someone who visits your website once and disappears versus someone who signs up for a trial, uses a key feature, and reaches out to your support team. The second person is obviously far more engaged.
This relationship is a collection of meaningful touchpoints. These actions are signals that a customer is getting value from what you offer. For an e-commerce store, real engagement might look like repeat purchases and product reviews. For a SaaS platform, it’s probably daily logins and consistent feature use.
Why You Should Measure Engagement
Tracking these interactions is directly tied to the health of your business. It’s pretty simple: engaged customers are more likely to stick around, spend more, and tell their friends about you. A drop in engagement is often the first red flag signaling potential churn.
Measuring engagement helps you:
- Predict and Reduce Churn: When you spot disengaged users early, you can step in with targeted support or a re-engagement campaign before they decide to leave for good.
- Increase Customer Lifetime Value (CLV): Customers who actively use your product and feel a connection to your brand are way more likely to upgrade their plans or make repeat purchases down the line.
- Improve Your Product: Engagement data is a goldmine. It shows you which features your customers love and which ones they’re ignoring. That kind of feedback is priceless for guiding your product roadmap.
The Problem with One-Size-Fits-All Metrics
A huge mistake companies make is grabbing generic engagement metrics and applying them to their business. A high number of daily active users might be a fantastic metric for a social media app, but it could be misleading for a B2B accounting tool that's only used once a month during payroll. Your measurement strategy has to fit your specific business model and goals.
For SaaS companies, tracking feature adoption is one of the best ways to measure engagement and identify at-risk accounts. Improving the adoption of one or two key features can slash churn by 15–20% in the first 90 days.
Picture a project management tool where 80% of new users create a project, but only 30% use the collaboration feature. That’s a massive insight. It tells the team they need to create targeted onboarding to push adoption of those "sticky" features. In fact, users who adopt three or more core features often have a 50% higher CLV. You can discover more customer engagement metrics every CS leader should track to see how top companies are building health scores around this kind of data.
The goal is to understand the story the numbers tell about your customers' journey. An engaged customer is a healthy customer, and a healthy customer base is the foundation for sustainable growth.
Defining Your Engagement Goals and Metrics
Before you can measure anything, you have to know what you’re looking for. Defining customer engagement for your business is about identifying the specific user actions that signal a healthy, active customer who's getting real value from your product.
A simple question gets you started: What does an ideal, engaged customer do? The answer will look completely different depending on your business.
- For a B2B SaaS company like Asana, an engaged customer might invite team members, integrate with another tool like Slack, or use a premium feature multiple times a week.
- For an e-commerce brand, engagement might be defined by repeat purchase frequency, writing a product review, or signing up for a loyalty program.
These actions are your North Star. They represent the moments where a user truly benefits from what you provide.
Find Your "Aha Moment"
The "aha moment" is that magical point when a user suddenly gets your product's core value. For Facebook, it was when a user connected with 7 friends in 10 days. For Slack, it might be when a team sends 2,000 messages. Your first job is to figure out what that moment is for your customers.
Take a look at your most successful, long-term customers. What did they do in their first week? Which features did they adopt first? The path they took is a roadmap you can use to guide new users toward that same moment of clarity.
Choose a Mix of Metrics
A good measurement framework uses a blend of numbers and feedback. You need quantitative data to see what is happening and qualitative insights to find out why. Relying on just one gives you an incomplete picture.
You might see that your Daily Active Users (DAU) number is high, which seems great on the surface. But if customer satisfaction surveys show those same users are frustrated and confused, you have a problem hiding in plain sight. Combining both types of data gives you the full story.
To build a balanced strategy, you need to know the role each type of metric plays.
Quantitative vs Qualitative Engagement Metrics
A comparison of different types of metrics, their purpose, and examples for each category to help you build a balanced measurement strategy.
By pairing these two types of metrics, you get a much clearer, more accurate view of customer health. The numbers tell you what’s happening, and the feedback tells you why it matters to your users.
Instead of getting lost in dozens of vanity metrics, this framework helps your team concentrate on the handful of metrics that truly reflect customer health and predict business growth.
The most effective engagement strategies are built on a clear definition of what success looks like for your customers. Once you know which actions lead to long-term value, you can build a system to measure and encourage those behaviors.
Picking the Right Numbers to Measure Engagement

Alright, time to roll up our sleeves and get into the numbers. Quantitative metrics are the backbone of any solid engagement strategy. They provide the hard data you need to see exactly how people are interacting with your product or website.
These numbers tell a story about user habits, product health, and potential revenue. When you track the right things, you stop guessing what your customers want and start knowing what they actually do.
User Activity and Product Stickiness
The most basic place to start is simply seeing how often people show up. Daily Active Users (DAU) and Monthly Active Users (MAU) are exactly what they sound like: counts of unique users who interact with your product daily or within a 30-day window.
The real magic happens when you put them together.
The DAU/MAU ratio is a fantastic indicator of product "stickiness." It tells you what percentage of your monthly users are so hooked that they come back every single day.
DAU/MAU Ratio = (Daily Active Users / Monthly Active Users) x 100
What's a "good" ratio? It completely depends on your industry. A social media app might shoot for 50% or higher, showing it’s part of a user's daily routine. A B2B accounting tool might have a perfectly healthy ratio of just 10% because users only need it to run payroll once a month. The key is setting a benchmark that makes sense for your business model.
If you need more help figuring out what to track, our guide on key customer success metrics is a great place to start.
Session Behavior and Frequency
Beyond counting users, you need to know the depth of their visits. Two simple metrics give you that context:
- Session Duration: This is the average time a user spends in your app or on your website during a single visit. Longer can be better, but context is everything. A user spending 15 minutes on a blog post? Great. A user spending 15 minutes trying to figure out a two-step checkout? Not so great.
- Session Frequency: This tracks how often the average user comes back over a specific period, like a week or a month. High frequency is a strong sign that your product is becoming a habit.
Speaking of keeping users around, it's important to work on strategies for how to reduce website bounce rate. A high bounce rate means people are leaving after viewing just one page, which tanks your session duration and signals that your content isn't compelling enough to keep them exploring.
Feature Adoption and Usage
Knowing which parts of your product people use is one of the most direct ways to measure engagement. The Feature Adoption Rate tells you what percentage of your user base has tried a specific feature.
Feature Adoption Rate = (Number of users who used a feature / Total number of users) x 100
Think about a project management tool. It might find that 90% of new users create a task (a core feature), but only 25% ever use the reporting dashboard. That insight is gold. It’s a huge flashing sign that you have an opportunity to improve onboarding or use in-app guides to highlight the feature’s value.
Financial and Revenue-Linked Metrics
At the end of the day, engagement needs to drive business growth. Connecting user activity to financial outcomes shows the real-world impact of your work.
Customer Lifetime Value (CLV) is one of the most important metrics here. It predicts the total revenue you can expect from a single customer over their entire relationship with you. A highly engaged user who sticks around longer and upgrades their plan will naturally have a much higher CLV.
For e-commerce, the Repeat Purchase Rate is another fantastic metric. It measures the percentage of customers who come back to buy again, proving their loyalty and satisfaction. A rising repeat purchase rate is a clear sign that your engagement efforts are turning one-time buyers into genuine fans.
Going Beyond the Numbers to Find the "Why"
The quantitative data we've talked about gives you a crystal-clear picture of what your customers are doing. You can see how often they log in, which features they love, and how long they stick around. But numbers alone can't tell you why a once-active user suddenly stopped using a key feature, or why another customer unexpectedly became a power user overnight.
For that, you need to dig into qualitative insights.
This kind of feedback breathes life into your data, adding the human story that explains the numbers. It’s the context you need to really see the feelings, frustrations, and motivations driving what people do in your product. Without it, you're only seeing half the picture.
Using Surveys to Take the Pulse of Customer Sentiment
Surveys are one of the most direct ways to simply ask customers how they feel. When you use them the right way, they act as a powerful pulse check on customer loyalty and overall satisfaction.
Three of the most common and effective survey types are NPS, CSAT, and CES.
- Net Promoter Score (NPS): This is all about long-term loyalty. It hinges on a single question: "On a scale of 0-10, how likely are you to recommend our product to a friend or colleague?"
- Customer Satisfaction (CSAT): This one gauges short-term happiness with a specific interaction, like right after a support ticket is closed or a purchase is made. The question is usually, "How satisfied were you with your experience today?" on a 1-5 scale.
- Customer Effort Score (CES): This metric tells you how easy it was for a customer to get something done. A typical question is, "How much effort did you personally have to put forth to handle your request?"
These are strong predictors of business performance. Companies in the top quartile of NPS scores for their industry typically outgrow their competitors by at least 2x. It works because you can tie customer sentiment directly to behavior.
For example, you might discover that your NPS "Detractors" (those who score 0-6) have a 40% lower feature adoption rate and are three times more likely to churn. Armed with that knowledge, you can start building proactive workflows to step in and support these at-risk users before it's too late.
Don't Stop at Standard Surveys
While NPS and CSAT are fantastic starting points, they aren't the only way to hear what your customers are thinking. To get the full story, you need to listen across multiple channels. This creates a continuous feedback loop that can inform everything from your product roadmap to your marketing messages.
Consider adding these other methods to your toolkit:
- User Interviews: A single 30-minute conversation with a customer can uncover more genuine insights than a hundred survey responses ever could. These are perfect for exploring complex issues and learning how people use your product day-to-day.
- Feedback Forms: Think of this as a digital suggestion box. Simple forms embedded in your app or on your website give users an easy, low-friction way to share ideas or report frustrations the moment they happen.
- Support Ticket Analysis: Your support inbox is a goldmine of qualitative data. Look for recurring themes, common questions, and persistent pain points that customers are bringing to your team.
You can learn more about how to structure these listening posts by exploring different types of voice of the customer surveys.
Weaving Feedback into Your Workflow
The goal is to make gathering feedback an automated, natural part of the customer journey, not just a one-off campaign you run every quarter. This is where the right tools can make a massive difference.
By triggering surveys based on specific user actions, you gather feedback when it’s most relevant and fresh in the customer's mind. This timely approach dramatically increases response rates and the quality of the insights you receive.
For example, a platform like Surva.ai lets you set up these kinds of automated triggers with ease. You could send a CSAT survey immediately after a customer successfully uses a new feature for the first time. Or, if a user's activity level drops for a week straight, you could automatically send a short, open-ended survey asking if they need any help.
This approach turns feedback from a passive activity into a proactive, real-time conversation that actively improves the customer experience.
How to Analyze and Act on Your Engagement Data
Collecting a mountain of engagement data is one thing. Knowing what to do with it is where the magic happens. The real value comes when you start digging into that information, spotting patterns, and using what you learn to make smart business decisions. This is how you connect the dots between what users are doing and what your business needs to do next.
Turning those raw numbers into a clear strategy means slicing your user base into meaningful groups, creating at-a-glance health scores, and even building automated workflows to act on what you find. It's about making your data work for you, not the other way around.
Segment Users into Cohorts for Deeper Insights
If you're looking at your entire user base as one giant blob, you're missing the story. To get what's going on with engagement, you have to break your users down into smaller, similar groups, or cohorts. This lets you compare behavior and spot trends that would otherwise be invisible.
You can segment users based on pretty much any shared characteristic. Some of the most common and useful cohorts are:
- Acquisition Date: Grouping users by the week or month they signed up is a classic. It’s perfect for seeing if that new onboarding flow you launched last quarter improved long-term engagement for newer users compared to the old guard.
- User Behavior: This is where it gets fun. Create segments for your "power users," the ones who adopted key features right away, versus your "casual users" who only pop in once in a while. You can also group users who have stopped using a specific feature to figure out if something's broken or just confusing.
- Plan Type: Comparing engagement between users on your free plan and your premium tiers is a must. This can tell you exactly which features are compelling enough to drive upgrades and help you fine-tune your pricing strategy.
By analyzing these smaller groups, you stop dealing with vague averages and start getting specific, actionable insights about different corners of your audience.
Create a Customer Engagement Score
With so many different metrics to track, it can be tough to get a quick read on an account's overall health. This is where a customer engagement score comes in. Think of it like a credit score for customer health. It rolls several key metrics into a single, weighted number.
First, you need to identify the actions that are most strongly linked to retention and high customer value. For a typical SaaS product, you might look at things like:
- Daily logins
- Number of key features used
- Team members invited
- Recent NPS score
Next, you assign a weight to each action based on how important it is. For example, using a core feature is probably worth more points than just logging in. When you add up these weighted actions, you get a single score that tells you, at a glance, just how healthy a customer is. This score is invaluable for helping your customer success team prioritize who to talk to first.
Visualize Your Data and Track Progress
Data is only useful if people can make sense of it. Setting up a dashboard with your key engagement metrics allows everyone on the team, from product to marketing, to see progress and spot trends in real-time. Tools like Google Analytics, Mixpanel, or other business intelligence platforms can pull all your data into one neat, tidy place.
A solid dashboard should visualize:
- Your overall customer engagement score over time.
- Engagement levels across your different user cohorts.
- The adoption rates of your most important features.
- Trends in your qualitative metrics like NPS and CSAT.
This visual approach makes it so much easier to communicate what you're finding and keep the entire team pulling in the same direction. If you want to get deeper into interpreting this kind of data, check out our guide on how to analyse survey data.
The most powerful view comes from blending the "what" (your quantitative data) with the "why" (your qualitative feedback). Companies that get this right report an 89% greater ability to retain customers. Let’s say you see a 15% drop in the usage of a key feature. A quick, targeted in-app survey could reveal it’s because a recent UI update made things confusing. This combined approach can improve your churn prediction accuracy by up to 45% and gives you a clear roadmap for what to fix.
Here’s a simple flow I like for gathering qualitative feedback to add color to your numbers.
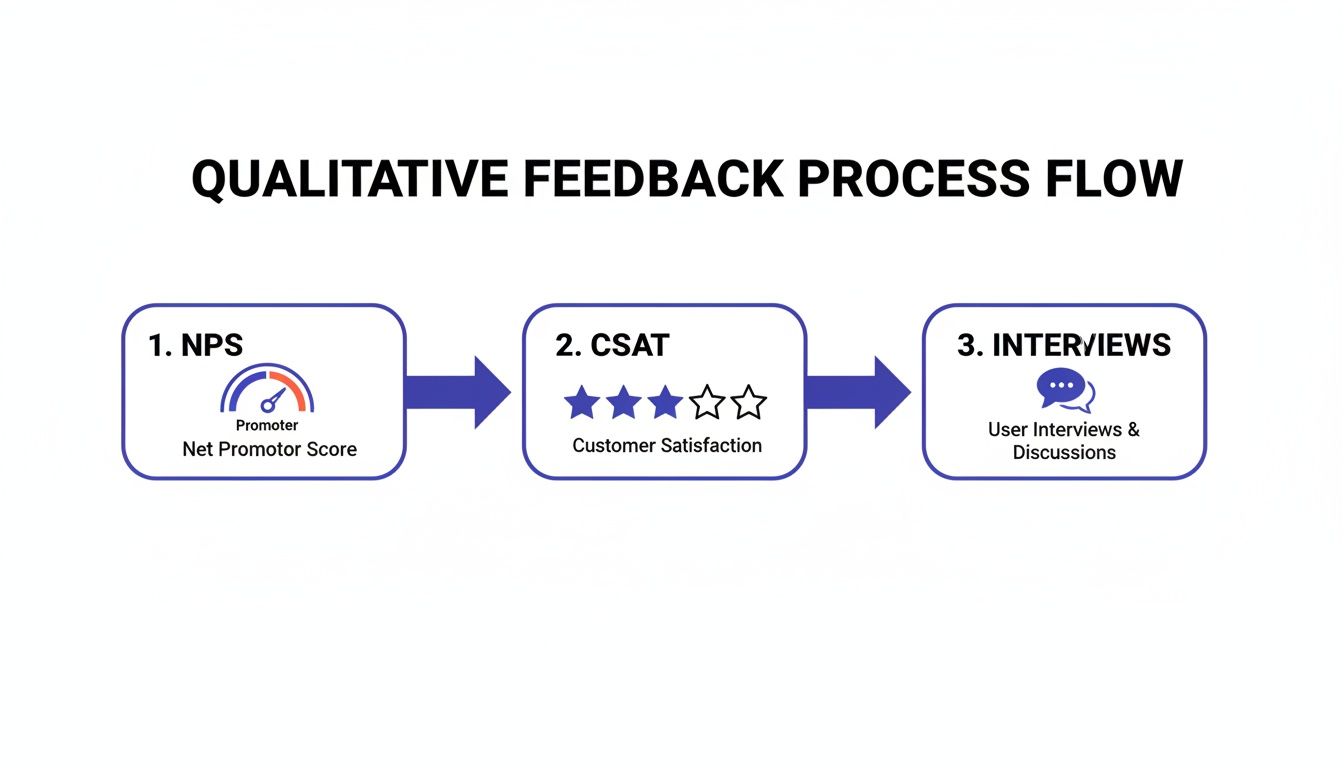
This process shows how you can move from broad sentiment (NPS), to specific interaction feedback (CSAT), and finally to a deep, contextual view through interviews.
Turn Your Insights into Action
All the analysis in the world is pointless if you don't do anything with it. The final and most important step is to operationalize your insights by building systems that automatically respond to changes in user engagement.
Here are a few practical ways to put this into motion:
- Automate Re-engagement Workflows: Set up triggers based on that engagement score we talked about. If a user’s score drops below a certain point, automatically enroll them in an email sequence that reminds them of valuable features they haven't used or offers a hand from a support specialist.
- Personalize Onboarding: Use early engagement signals to adjust the onboarding experience. If a new user immediately invites their team members, the onboarding flow could shift to focus on collaboration features. If they seem stuck, you could trigger in-app guides to get them unstuck.
- Prioritize Your Product Roadmap: Listen to your most engaged users. They're your biggest fans and often have the best ideas. If your power users are constantly asking for a certain integration, that’s a massive signal to move it up the priority list.
Once you've got a handle on customer engagement, it's a good idea to connect those efforts back to the bottom line. Learning how to measure marketing ROI helps quantify the real business impact you're making. By creating these kinds of feedback loops, you turn measurement from a boring task into a powerful system for continuous improvement that fuels retention and growth.
Turning Measurement Into Sustainable Growth
Measuring customer engagement isn't a one-and-done project. Think of it as building a system for continuous learning, where you're always listening to what your customers' actions and words are telling you.
Get this right, and you're building a loyal customer base that will fuel your company's growth for the long haul. Ultimately, all this measurement is about making your product better and the experience more valuable for the people using it.
Your Quick-Start Checklist
Feeling a bit overwhelmed? Don't be. Here’s a simple checklist to get you on the right track without having to boil the ocean.
- Define Your Goals: First, figure out what a healthy, engaged customer looks like for your business. What specific actions do they take?
- Pick Your Metrics: Go for a balanced mix. You'll want hard numbers from your analytics (like DAU) combined with qualitative feedback from your users (like NPS).
- Set Up Tracking: Get your tools in place. This means setting up your analytics and getting your first surveys out the door to start collecting data.
- Analyze and Segment: Once the data starts rolling in, look for patterns. Group users into different cohorts to uncover those "aha!" moments and meaningful insights.
- Act and Iterate: This is where the magic happens. Use what you learn to improve the product, build automated re-engagement flows, and personalize the user experience.
The most important thing is to just start. You don't need a perfect, complex system on day one. Start small, track a few key metrics, and iterate on your measurement strategy over time.
Got Questions? We've Got Answers
When you first start digging into customer engagement, a few questions always pop up. Let's tackle the most common ones we hear from teams just like yours.
What Is a Good Customer Engagement Rate Anyway?
Honestly, there's no magic number. A "good" engagement rate is completely relative to your industry and how customers are supposed to use your product.
Think about it: for a social media app, a DAU/MAU ratio of 50% would be fantastic because it signals a daily habit. But if you're a B2B tax software, a 10% ratio might be incredibly healthy, since most users only need to log in once a month.
Instead of chasing someone else's numbers, focus on establishing your own baseline. The real goal is to see that number steadily climbing over time. Your own trend is far more important than a comparison to a totally different business.
How Often Should We Be Measuring This Stuff?
For your core quantitative metrics, like daily logins or feature adoption, you should have them on a real-time dashboard. This is your early warning system. It lets you spot a sudden drop or a surprising spike the moment it happens.
For the qualitative side of things, like NPS or customer satisfaction surveys, running them quarterly is a solid starting point for most SaaS companies. It gives you enough time to see trends without overwhelming your customers.
The real key here is consistency. Make reviewing your engagement data a fixed part of your team's rhythm, whether it's a weekly huddle or a bi-weekly review. Keeping it on the agenda makes sure it stays top of mind.
Measuring engagement is an ongoing conversation with your customers. Consistent tracking is the only way you'll see the long-term impact of your product updates and marketing efforts.
Okay, So How Do We Actually Improve Our Engagement?
Improving engagement always starts with a clear view of what the data is telling you. Once you've pinpointed which customer segments are drifting away or which features are collecting dust, you can get tactical.
Here are a few strategies that consistently move the needle:
- Personalize the Onboarding: Don't give everyone the same generic tour. Build guided walkthroughs that steer new users directly to the features that will deliver their "aha moment" as quickly as possible.
- Communicate Proactively: Use in-app messages or targeted email campaigns to shine a spotlight on valuable features that specific user groups aren't touching. Sometimes, they just don't know what they're missing.
- Act on Feedback (and Tell Them You Did!): When customers take the time to give you feedback through a survey, acting on it is only half the job. Closing the loop to let them know you listened is a massive driver of loyalty.
This work pays off, big time. One of the best metrics to watch here is Customer Lifetime Value (CLV), which is a prediction of the total revenue you can expect from a single customer account. Why? Because improving retention by just 5% can crank up profits by 25% to 95%. That's the kind of ROI that makes focusing on engagement a no-brainer. You can discover more insights about customer engagement metrics on emarsys.com to dig deeper.
Ready to turn feedback into growth? Surva.ai gives SaaS teams the tools to see user sentiment, deflect churn, and build a better product. Start collecting actionable insights today.
Sophie Moore
Sophie is a SaaS content strategist and product marketing writer with a passion for customer experience, retention, and growth. At Surva.ai, she writes about smart feedback, AI-driven surveys, and how SaaS teams can turn insights into impact.