6 Top Survey Report Example Styles for 2025
Discover 6 top-tier survey report example styles. Learn to structure your data, visualize insights, and create reports that drive action.

You’ve collected the data, but now what? Transforming raw survey responses into a compelling, insightful report is the critical step that turns data into decisions. A well-structured survey report doesn't just present numbers; it tells a story, reveals hidden trends, and provides a clear roadmap for action. Without this final piece, even the most meticulously planned survey can fail to deliver its intended impact. This is where a strong survey report example becomes an invaluable tool, offering a blueprint for clarity and strategic communication.
This article moves beyond generic templates. We will deconstruct 8+ powerful survey report examples from diverse fields, including market research, employee engagement, and customer satisfaction. For each example, we'll break down the specific strategies they use to visualize data, structure their narrative, and present actionable takeaways. You won't just see what a good report looks like; you will understand why it works and how to replicate its success. Prepare to learn the specific tactics used by organizations like the Pew Research Center to translate complex data into clear, persuasive, and influential reports. Let's dive into the examples that will elevate your own reporting from simple data dumps to strategic assets.
1. Pew Research Center Survey Reports
When searching for the gold standard in public survey reporting, look no further than the Pew Research Center. As a nonpartisan fact tank, Pew sets the benchmark for how to present complex survey data with clarity, integrity, and depth. Their reports, covering everything from social media usage to global political attitudes, are a masterclass in turning raw data into an insightful, trustworthy narrative.
The core of Pew's approach is a commitment to methodological transparency. They don't just present findings; they meticulously detail how they arrived at those conclusions. This includes comprehensive information on sampling methods, question wording, and statistical weighting, which builds unparalleled credibility with the audience.
Strategic Analysis
Pew’s reports are effective because they prioritize context and accessibility without sacrificing scientific rigor. They understand that data points are meaningless without a framework for interpretation.
Strategic Insight: Pew excels at contextualizing data. A statistic, such as "45% of adults use platform X," is never left hanging. It's immediately followed by demographic breakdowns (age, gender, education), historical trends (how this number has changed over time), and comparisons to other platforms. This multi-layered approach transforms a simple number into a rich, actionable insight.
This strategy makes their work a prime survey report example for any organization aiming to establish thought leadership. By providing not just the "what" but the "why" and "so what," they empower readers to fully grasp the implications of the findings.
Replicable Strategies and Methods
You don't need Pew's budget to adopt its principles. Here are actionable tactics to elevate your own survey reports:
- Create a Dedicated Methodology Section: At the beginning or end of your report, include a brief section explaining who you surveyed, your sample size, the margin of error, and the dates the survey was conducted. This simple addition significantly boosts your report's credibility.
- Segment Your Key Findings: Don't just report on the overall results. Break down your most important data points by relevant audience segments. For a SaaS company, this could mean segmenting by user plan (free vs. premium) or company size.
- Visualize Trends Over Time: If you run the same survey periodically (e.g., quarterly or annually), always include charts that show how the data has changed. This demonstrates a long-term commitment to understanding your subject and provides more profound insights.
The infographic below highlights the essential components that make a Pew-style report so effective.
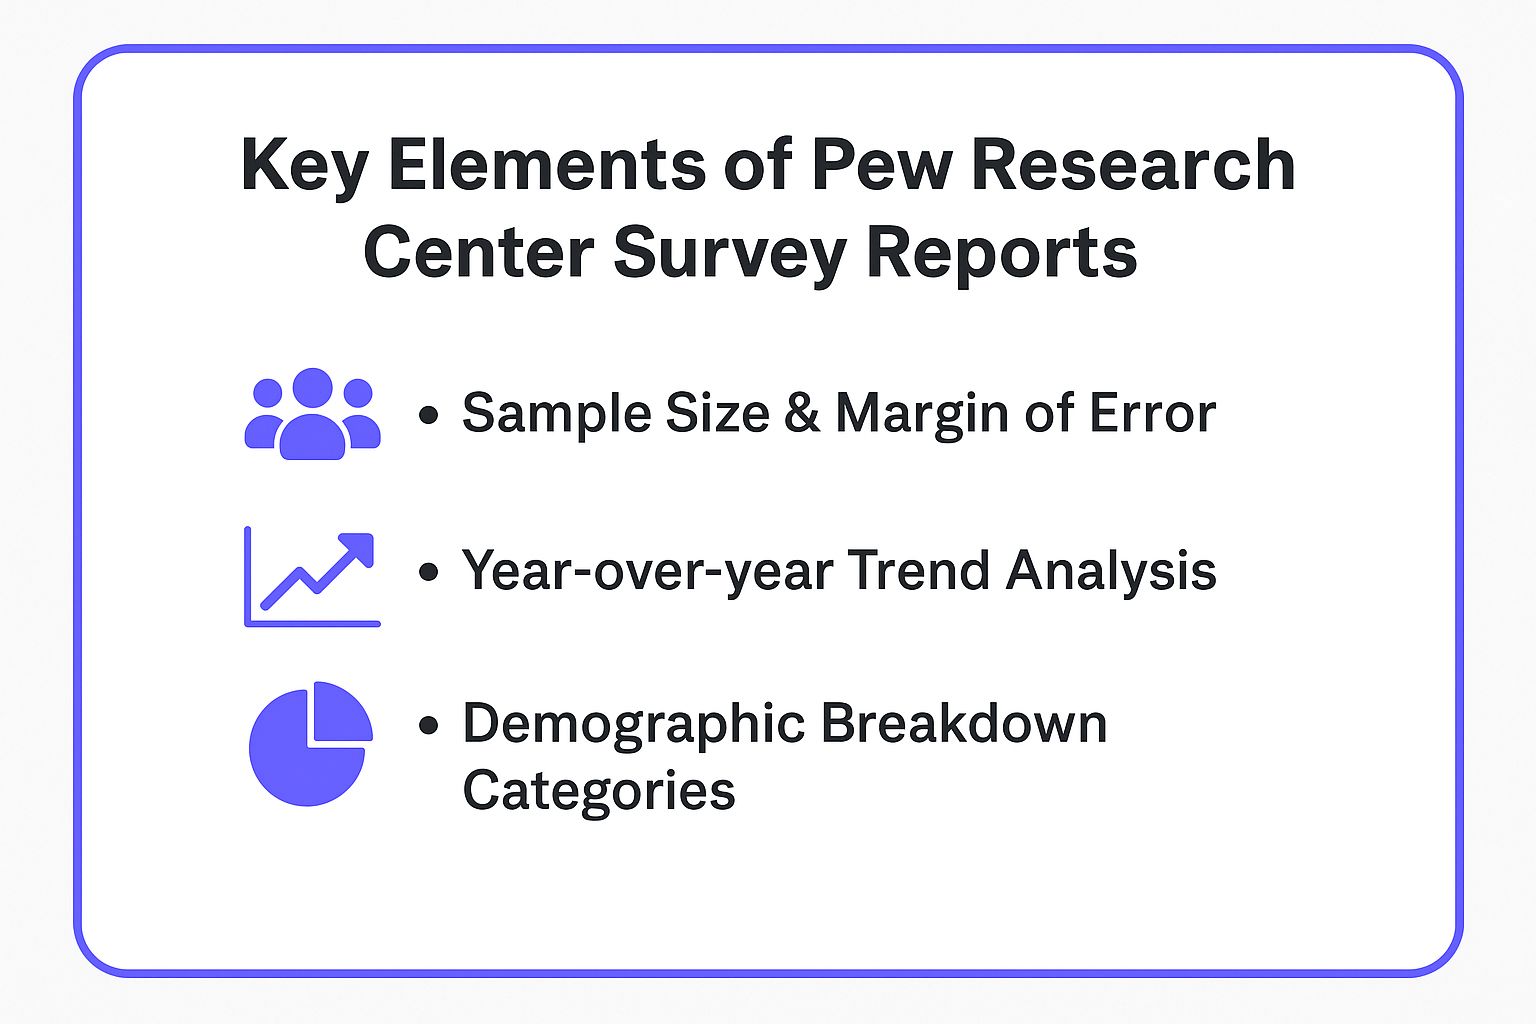
By consistently tracking these core elements, you build a comprehensive and authoritative view of your topic over time. These components are the foundation for creating reports that are not just informative but also serve as valuable, long-term assets for your organization.
2. Employee Engagement Survey Reports
Employee engagement survey reports are internal tools designed to measure workforce health, capturing crucial data on satisfaction, motivation, and alignment with company culture. Pioneered by organizations like Gallup and Culture Amp, these reports transform subjective feelings into objective metrics, providing leadership with a clear roadmap for improving retention, productivity, and overall workplace environment. They are a powerful internal survey report example for any organization focused on building a strong, committed team.

The strength of these reports lies in their direct link to business outcomes. High engagement is correlated with lower absenteeism, higher profitability, and better customer ratings. By systematically gathering and analyzing feedback, companies can move from guessing what employees want to making data-driven decisions that foster a thriving organizational culture.
Strategic Analysis
Effective employee engagement reports translate feedback into actionable initiatives. They don't just present scores; they connect the dots between different data points to reveal underlying issues and opportunities within the organization.
Strategic Insight: The best engagement reports segment data to reveal hidden truths. An overall engagement score of 85% might look great, but segmenting by department could reveal that the engineering team is at 95% while the sales team is at 60%. This focused insight allows for targeted, effective interventions rather than generic, company-wide programs that miss the mark.
This strategy ensures that the insights are not just interesting but directly applicable. It moves the report from a simple HR exercise to a critical strategic planning tool for management, pinpointing specific areas needing leadership attention and resources.
Replicable Strategies and Methods
You can implement a professional-grade employee engagement survey process without a massive budget. Here are key tactics to adopt:
- Guarantee Anonymity and Confidentiality: The foundation of honest feedback is trust. Clearly communicate that all responses are anonymous to encourage candid answers. Use a third-party tool if necessary to reinforce this promise.
- Balance Quantitative and Qualitative Data: Use scales (e.g., Likert scales) for easy-to-measure metrics but always include open-ended questions. Qualitative feedback provides the "why" behind the scores and often contains the most valuable suggestions for improvement. When drafting your survey, using a well-structured set of employee engagement survey questions is essential for capturing this mix of data effectively.
- Develop and Share Action Plans: A report without action is pointless. After analyzing the results, create a clear action plan with specific goals, owners, and timelines. Share both the key findings and the action plan transparently with all employees to show their feedback was heard and valued.
The video below explains how to turn employee feedback into meaningful action, a critical step in the engagement survey process.
By following these principles, you create a continuous feedback loop that not only measures but actively improves employee engagement, making it a cornerstone of your organizational strategy. This approach builds trust and demonstrates a genuine commitment to employee well-being and development.
3. Market Research Survey Reports
When business strategy hinges on understanding the market, reports from firms like NielsenIQ and McKinsey & Company provide the blueprint. Market research survey reports are designed to dissect consumer behavior, map competitive landscapes, and identify emerging trends. They serve as critical tools for companies making high-stakes decisions about product development, market entry, and brand positioning.
These reports blend quantitative data (the "what") with qualitative insights (the "why") to deliver a holistic view of the market. Their authority stems from rigorous methodologies, vast sample sizes, and the ability to connect disparate data points into a coherent, forward-looking narrative that guides strategic planning.
Strategic Analysis
The power of a professional market research report lies in its ability to translate complex data into clear, actionable business intelligence. These reports don't just present statistics; they interpret them within a broader economic and cultural context to reveal underlying opportunities and threats.
Strategic Insight: Top-tier market research reports excel at segmentation and forecasting. A finding like "demand for sustainable packaging is up 15%" is broken down by consumer demographics, geographic regions, and psychographic profiles. This is then used to forecast future growth, providing businesses with a clear roadmap for where to invest their resources for maximum impact.
This approach makes any well-executed market research study a powerful survey report example for organizations that need to justify significant investments or pivot their strategy based on solid evidence.
Replicable Strategies and Methods
While you may not have McKinsey's resources, you can apply the core principles of their reporting to your own market analysis. Here are some actionable strategies:
- Define Clear Research Objectives: Before launching your survey, clearly state what you want to learn. Are you testing a new product concept, evaluating brand perception, or analyzing purchase drivers? A focused objective prevents data overload and ensures your findings are relevant.
- Combine Quantitative and Qualitative Data: Supplement your survey's "what" (e.g., ratings, multiple-choice answers) with the "why" from open-ended questions or follow-up interviews. This adds depth and color to your quantitative findings.
- Provide Actionable Recommendations: Don't end your report with a data dump. Conclude with a dedicated section that outlines specific, data-backed recommendations. For example, "Based on our findings, we recommend targeting the 25-34 age demographic with a digital campaign focused on product feature X."
By integrating these methods, you can transform a simple survey into a strategic asset. You can learn more about how to leverage these findings in your broader strategy by reading about marketing and consumer insights.
4. Academic Research Survey Reports
For those seeking to build a report grounded in scholarly precision and irrefutable methodology, the academic research paper is the ultimate model. Published in journals like the Journal of Survey Statistics and Methodology or Psychological Science, these reports are designed not just to inform but to contribute to a field's body of knowledge. They prioritize transparency, replicability, and rigorous validation above all else.
The strength of an academic survey report lies in its structure and exhaustive documentation. Every step, from the initial research question and literature review to the statistical analysis and discussion of limitations, is laid out for peer scrutiny. This meticulous approach ensures that the findings are not only sound but can also be built upon by others. For academic researchers, especially when compiling extensive survey findings, drawing on general thesis writing tips can prove invaluable for maintaining this level of structure and clarity.
Strategic Analysis
Academic reports are effective because they are built on a foundation of established theory and context. They don't present data in a vacuum; instead, they frame the survey within a broader academic conversation, demonstrating how the new findings confirm, challenge, or expand upon existing knowledge.
Strategic Insight: The core strategy is validation through justification. An academic report justifies every choice: why a particular survey scale was used, why a specific statistical test was chosen, and how the sample represents the target population. This deep justification makes the conclusions highly defensible and authoritative, a key feature for any organization looking to produce a landmark survey report example in their industry.
This strategy is perfect for reports that need to withstand intense scrutiny or serve as a definitive resource on a complex topic.
Replicable Strategies and Methods
While you may not be submitting your report for peer review, you can borrow the core principles of academic rigor to make your own work more powerful. The comprehensive nature of academic reporting can be a great source of inspiration for a deeper analysis on survey data.
- Start with a Literature Review: Before presenting your findings, briefly summarize what is already known about your topic. This frames your work and shows you've done your homework, instantly boosting credibility.
- Document Methodological Decisions: Create a detailed appendix or section that explains why you made certain choices. Why did you use a 5-point Likert scale instead of a 7-point one? Why did you choose that specific demographic segmentation? Explaining your reasoning elevates your report from a simple data dump to a thoughtful analysis.
- Include a "Limitations and Future Research" Section: No survey is perfect. Transparently discuss the potential limitations of your study (e.g., small sample size, limited demographic scope). Then, suggest questions for future surveys. This shows foresight and intellectual honesty, building significant trust with your audience.
5. Customer Satisfaction Survey Reports
Customer Satisfaction (CSAT) survey reports are essential tools for any business focused on service quality and client loyalty. These reports transform subjective customer feelings into objective, measurable data by analyzing feedback on service, product quality, and overall experience. Companies like Amazon, Apple, and Uber leverage these reports to pinpoint service gaps, refine their offerings, and ultimately boost customer retention through data-driven decisions.
The power of a CSAT report lies in its directness. It cuts through assumptions and provides a clear view of what customers are actually thinking and feeling. This makes it an invaluable survey report example for organizations aiming to build a truly customer-centric culture.

Strategic Analysis
Effective CSAT reports go beyond a simple "happy" or "unhappy" score. They are designed to connect specific feedback to operational performance, making the voice of the customer a key driver of business strategy.
Strategic Insight: The most impactful CSAT reports correlate satisfaction scores with specific touchpoints in the customer journey. For example, a hotel chain doesn't just ask about the overall stay; it asks about check-in, room cleanliness, and staff helpfulness. This allows them to isolate problems and deploy targeted solutions, such as retraining front-desk staff or revising cleaning protocols, rather than guessing at what needs improvement.
This approach ensures that feedback is not just collected but is directly actionable, empowering teams to make specific changes that demonstrably improve the customer experience.
Replicable Strategies and Methods
You can implement a robust customer satisfaction feedback loop by adopting a few core practices popularized by pioneers like Bain & Company and platforms like Qualtrics.
- Use Multiple Touchpoints: Don't wait for an annual survey. Gather feedback immediately after key interactions, like a support ticket resolution or a new purchase. This provides timely, context-rich data.
- Segment Feedback by Journey Stage: Analyze satisfaction scores based on where the customer is in their lifecycle (e.g., onboarding, post-purchase, renewal). This reveals potential friction points unique to each stage.
- Act Quickly on Negative Feedback: Establish a clear process for following up on poor reviews. A prompt, personal response can often turn a negative experience into a positive one and prevent customer churn. For more guidance, explore these free customer satisfaction survey templates on surva.ai.
- Track Key Metrics Over Time: Monitor metrics like Net Promoter Score (NPS), Customer Satisfaction Score (CSAT), and Customer Effort Score (CES) on a continuous basis. Charting these trends provides a clear picture of whether your improvement efforts are succeeding.
6. Healthcare Survey Reports
When survey reports carry the weight of public health policy and patient outcomes, the standard for rigor and clarity becomes exceptionally high. This is the domain of healthcare survey reports, such as those from the Centers for Medicare & Medicaid Services (CMS) and the CDC. These reports assess everything from patient satisfaction to public health risks and are foundational to improving healthcare quality and safety.
The defining characteristic of these reports is their unyielding adherence to standardized, validated methodologies. Given the sensitive nature of health data and the direct impact on human lives, these surveys must be meticulously designed to be reliable, repeatable, and compliant with strict privacy regulations like HIPAA. They serve as a crucial feedback loop for hospitals, policymakers, and public health officials.
Strategic Analysis
Healthcare reports are effective because they translate complex patient feedback and clinical data into clear, actionable metrics for improvement. They move beyond simple satisfaction scores to identify specific points of friction in the patient journey, from communication with nurses to hospital cleanliness.
Strategic Insight: The power of a healthcare survey report lies in its direct link to accountability and action. Reports like the HCAHPS (Hospital Consumer Assessment of Healthcare Providers and Systems) survey publicly tie patient experience scores to hospital payment incentives. This creates a powerful motivation for organizations to not just read the report, but to implement changes based on its findings.
This makes the healthcare survey a compelling survey report example for any business where service quality is paramount. It demonstrates how to structure a survey that drives operational change by linking feedback directly to performance metrics and tangible outcomes.
Replicable Strategies and Methods
While you may not be dealing with life-or-death scenarios, the principles of healthcare reporting can bring immense value to customer experience programs.
- Use Validated Questions: Whenever possible, use established and validated question formats to measure core concepts like satisfaction or loyalty. For example, instead of inventing a new satisfaction question, use a standard Likert scale or Net Promoter Score (NPS) question. This ensures you are measuring what you intend to measure.
- Focus on Actionable Dimensions: Structure your survey around key dimensions of the customer experience that your team can actually influence. For a SaaS product, this could be "ease of onboarding," "quality of support," and "clarity of documentation."
- Ensure Data Privacy and Anonymity: Clearly communicate your data privacy policy and assure respondents that their individual feedback will be handled confidentially. This is especially important for employee or sensitive customer feedback surveys, as it significantly increases honest participation.
Survey Report Types Comparison
Survey Report TypeImplementation Complexity 🔄Resource Requirements ⚡Expected Outcomes 📊Ideal Use Cases 💡Key Advantages ⭐Pew Research Center Survey ReportsHigh (rigorous methodology, long timelines)High (expert sampling, analytics, visualization)Credible, comprehensive social & demographic insightsPublic opinion research, trend analysisHigh credibility, detailed methodology, professional visualsEmployee Engagement Survey ReportsMedium (Likert scales, scoring systems)Medium (survey tools, follow-up)Actionable HR insights, improved retentionWorkplace satisfaction, management decisionsDirect business impact, targeted interventionsMarket Research Survey ReportsMedium-High (quant & qual methods, competitive analysis)Medium-High (data collection & analytics)Business strategy, market opportunities identificationConsumer behavior, product developmentSupports strategy, competitive intelligence, risk reductionAcademic Research Survey ReportsHigh (scholarly standards, peer review)High (rigorous analysis, peer review)Contributes to knowledge, reproducible resultsAcademic studies, hypothesis testingMethodological rigor, peer-reviewed credibilityCustomer Satisfaction Survey ReportsMedium (metric tracking, churn analysis)Medium (survey platforms, repeated measurement)Measurable customer feedback and retention improvementCustomer experience, service gap analysisDirect feedback, identifies service gaps, actionable dataHealthcare Survey ReportsHigh (regulatory compliance, privacy)High (validated tools, complex approvals)Improved patient care quality, regulatory complianceHealthcare quality improvement, policySupports evidence-based medicine, meets regulations
Final Thoughts
Transforming raw survey data into a compelling, insightful narrative is both an art and a science. Throughout this guide, we've dissected a diverse range of survey report examples, moving beyond surface-level descriptions to uncover the strategic thinking behind each one. From the authoritative rigor of Pew Research Center reports to the actionable insights of employee engagement surveys, a clear pattern emerges: the most effective reports do more than just present data; they tell a story that drives action.
We've seen how top-tier reports leverage a strong executive summary to hook the reader, use a clear methodology to build credibility, and employ powerful data visualizations to make complex information immediately understandable. The goal is to guide your audience through the findings, not just show them a spreadsheet.
Key Takeaways for Crafting Your Own Survey Report
Let's distill our analysis into core principles you can apply directly to your next project. Mastering these will elevate your work from a simple data dump to a strategic asset.
- Structure is Strategy: The way you organize your report is as important as the data itself. Start with a powerful summary, clearly state your objectives and methodology, and then guide the reader through your key findings before presenting a conclusive summary with actionable recommendations.
- Visuals Tell the Story: As seen in the best market research and customer satisfaction examples, charts and graphs are not just decorative. Use bar charts for comparisons, pie charts for proportions, and line graphs for trends. Always label your axes clearly and use a legend. The right visual can communicate a key insight faster than a paragraph of text.
- Context is King: Data without context is meaningless. Always frame your findings within the larger business or research question. Why does a 10% increase in customer satisfaction matter? What are the business implications of low employee engagement in a specific department? Connecting the dots is your primary job as a report creator.
Your Actionable Next Steps
Feeling inspired? Here’s how to put these lessons into practice and start creating reports that command attention and drive change.
- Define Your "Why": Before you even look at the data, re-confirm the primary objective of your survey. What single question must this report answer for your stakeholders? Write it down and keep it visible.
- Outline Your Narrative: Using the structures we've analyzed, create a skeleton outline for your report. Start with the executive summary, map out your key finding sections, and plan your conclusion. This creates a logical flow.
- Select Your "Hero" Visuals: For each key finding, choose one "hero" data visualization that best tells the story. Don't overwhelm your audience with dozens of charts; focus on the most impactful ones. A great survey report example always demonstrates this kind of focused, strategic visual communication.
- Analyze and Iterate: Once you have a draft, review it through the eyes of your audience. Is the key message clear? Are the recommendations specific and actionable? To truly understand the impact of your survey and present your findings effectively, exploring the best content analytics tools can provide invaluable insights into how your audience engages with the report itself.
By embracing these principles, you move from being a data collector to a strategic communicator. You build reports that don't just sit in an inbox but become the foundation for critical business decisions, product improvements, and marketing strategies. This is the true power of a well-crafted survey report.
Ready to create stunning, insightful survey reports without the manual hassle? Surva.ai uses AI to automatically analyze your data and generate a comprehensive, presentation-ready report in minutes. Stop wrestling with spreadsheets and start uncovering the stories in your data by visiting Surva.ai today.
Sophie Moore
Sophie is a SaaS content strategist and product marketing writer with a passion for customer experience, retention, and growth. At Surva.ai, she writes about smart feedback, AI-driven surveys, and how SaaS teams can turn insights into impact.